Soybean/Corn Ratio: A Lesson In Pairs Trading
Summary
- Agricultural commodity prices have retreated from their peaks in 2022, but there have been profitable trading opportunities in 2023.
- The Soybean/Corn ratio, like the Gold/Silver ratio, offers insights into the relative prices of these commodities.
- Instead of using futures, the aforementioned pairs trade could also be executed using the corn and soybean ETFs, which are the Teucrium Corn Fund and Teucrium Soybean Fund.

SimonSkafar
By Andrew Prochnow
Agricultural commodity prices have significantly retreated from the peaks observed in 2022. Nevertheless, it's important to note that there have been profitable trading opportunities within this sector of the financial markets in 2023. One such opportunity emerged at the end of August, and those who acted swiftly by investing in an elevated Soybean/Corn ratio have unquestionably witnessed a significant upturn in their fortunes over the past six weeks.
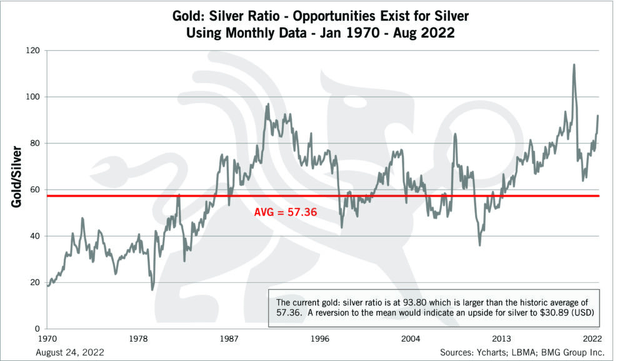
Much like the Gold/Silver ratio, the Soybean/Corn ratio offers valuable insights into the relative prices of these two commodities. To illustrate, the Gold/Silver ratio is determined by dividing the price per ounce of gold by the price per ounce of silver. The resulting quotient indicates how many ounces of silver are needed to purchase one ounce of gold at any given moment.
Over the last two decades, the Gold/Silver ratio has fluctuated between approximately 40 and 120. When this ratio approaches one of these extremes, investors and traders often engage in spread trading strategies designed to profit from its reversion to the historical average, which is typically around 60.
For instance, when the ratio is at its lower end, requiring only 40 ounces of silver to buy an ounce of gold, it suggests that gold is relatively inexpensive. In such a scenario, an investor or trader might consider purchasing gold while simultaneously selling silver, a trade that benefits as the Gold/Silver ratio returns to its historical average.
Conversely, when the Gold/Silver ratio surges toward the higher end of its historical range, indicating that gold is relatively expensive, spread traders may execute the opposite strategy—selling gold while concurrently buying silver. This strategy becomes profitable when the price of gold declines more rapidly than the price of silver, causing the Gold/Silver ratio to move back toward its historical mean.
As a point of reference, the current Gold/Silver ratio is approximately 85 ($1,945 divided by $22.90 equals 85), signifying that it presently resides at the upper end of its historical range.

Ycharts
Analyzing the Recent Collapse in the Soybean/Corn Ratio
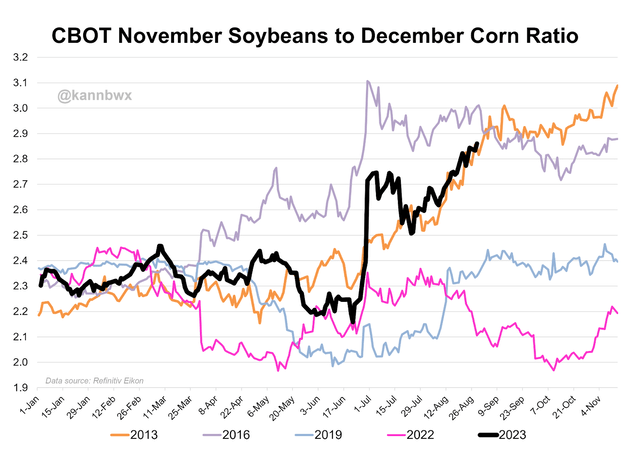
Just as the Gold/Silver ratio serves as a useful tool for investors and traders, the Soybean/Corn ratio plays a similar role in evaluating the comparative values of these two vital agricultural commodities. Historically, the Soybean/Corn ratio has typically ranged from approximately 2 to 3.
As of the current market conditions, where soybeans are priced at $12.80 per bushel and corn is trading at $4.94 per bushel, the Soybean/Corn ratio stands at approximately 2.59 ($12.80/$4.94 = 2.59). This value is quite near the midpoint of the historical range of the Soybean/Corn ratio, which has averaged around 2.51 over the past two decades.
However, on Aug. 30, the Soybean/Corn ratio surged to 2.84. At that time, soybeans were trading at approximately $13.70 per bushel, while corn was priced at around $4.82 per bushel.
At 2.84, the Soybean/Corn ratio was trading near the upper end of its historical extreme, indicating that soybeans were relatively expensive compared to corn (illustrated below).

Reuters
If an investor or trader concurred with this perspective and aimed to take action, they might opt to pair a short position in soybeans with a long position in corn. Reviewing the trading activity over the past six weeks vividly illustrates how this paired trade strategy played out exceptionally well.
Starting from Aug. 30, soybean prices have decreased by approximately $0.90 per bushel ($13.70 - $12.80 = $0.90). Concurrently, corn prices have actually appreciated during this same period, rising by approximately $0.12 per bushel ($4.94 - $4.82 = $0.12).
In this specific case, the spread trader who sold soybeans and bought corn profited from both aspects of the spread, with soybeans declining in value and corn increasing. It's important to note that such favorable outcomes may not occur every time.
Since Aug. 30, the Soybean/Corn ratio has dropped from 2.84 back down to 2.59, just above the long-term average of around 2.51. This beneficial outcome is evident for pairs traders who executed the strategy of selling soybeans and buying corn.
It's essential to understand that even if the Soybean/Corn ratio reaches an extreme, it doesn't guarantee success for the associated spread or pairs trade. In some instances, the ratio may move further away from its average, resulting in losses for the spread position, or it might remain at the same level, leading to a break-even situation.
Nonetheless, historical data demonstrates that over time, the Soybean/Corn spread tends to revert to its historical average. It's just that in some instances, the investor or trader with the spread position may encounter a temporary capital drawdown before this happens.
Therefore, pairs traders should maintain sufficient capital reserves to weather short-term or medium-term losses, as these positions frequently return to a profitable state with time. In 2023, however, this precaution wasn't necessary because, after reaching its peak in late summer, the Soybean/Corn ratio steadily declined, resulting in positive returns for those who implemented the short soybeans and long corn spread trade in late August.
It's worth noting that the soybeans futures contract is approximately twice the value of the corn futures contract, allowing for a flexible spread structure, like 1x2 or even 1x3. The exact structure chosen will depend on the individual investor or trader's outlook and whether they desire a balanced trade or one with a bias toward either leg.
For those interested in learning more about trading agricultural futures, a helpful video on the tastylive financial network is available. Looking ahead, investors and traders engaged in pairs trading can also keep a close eye on the Gold/Silver ratio, especially if it continues to rise in the coming weeks and months.
Note: Instead of using futures, the aforementioned pairs trade could also be executed using the corn and soybean ETFs, which are the Teucrium Corn Fund (NYSEARCA:CORN) and Teucrium Soybean Fund (NYSEARCA:SOYB).
Andrew Prochnow has more than 15 years of experience trading the global financial markets, including 10 years as a professional options trader. Andrew is a frequent contributor Luckbox Magazine.
Disclaimer: Investing carries risk. This is not financial advice. The above content should not be regarded as an offer, recommendation, or solicitation on acquiring or disposing of any financial products, any associated discussions, comments, or posts by author or other users should not be considered as such either. It is solely for general information purpose only, which does not consider your own investment objectives, financial situations or needs. TTM assumes no responsibility or warranty for the accuracy and completeness of the information, investors should do their own research and may seek professional advice before investing.

