Hecla Mining: Dealing With Lucky Friday's Setback
Summary
- Hecla Mining Company reported preliminary silver and gold production for Q3 2023, with silver production down 7.8% QoQ and gold production up 11.4% QoQ.
- The drop in silver production is attributed to issues at the Lucky Friday mine, which experienced a mine-shaft fire in September.
- Hecla Mining's stock performance has underperformed compared to gold and silver ETFs due to the challenges faced at the Lucky Friday mine.
- I recommend buying Hecla stock between $3.70 and $3.45 with lower support at $3.20.
RHJ
Idaho-based Hecla Mining Company (NYSE:HL) announced its preliminary silver and gold production for the third quarter on October 12, 2023.
As I have said previously, the company is mistakenly considered a silver miner. Even so, Hecla Mining is the United States’ largest silver miner, producing 45% of all the silver mined. However, it represents only 1.8% of the total Production worldwide.
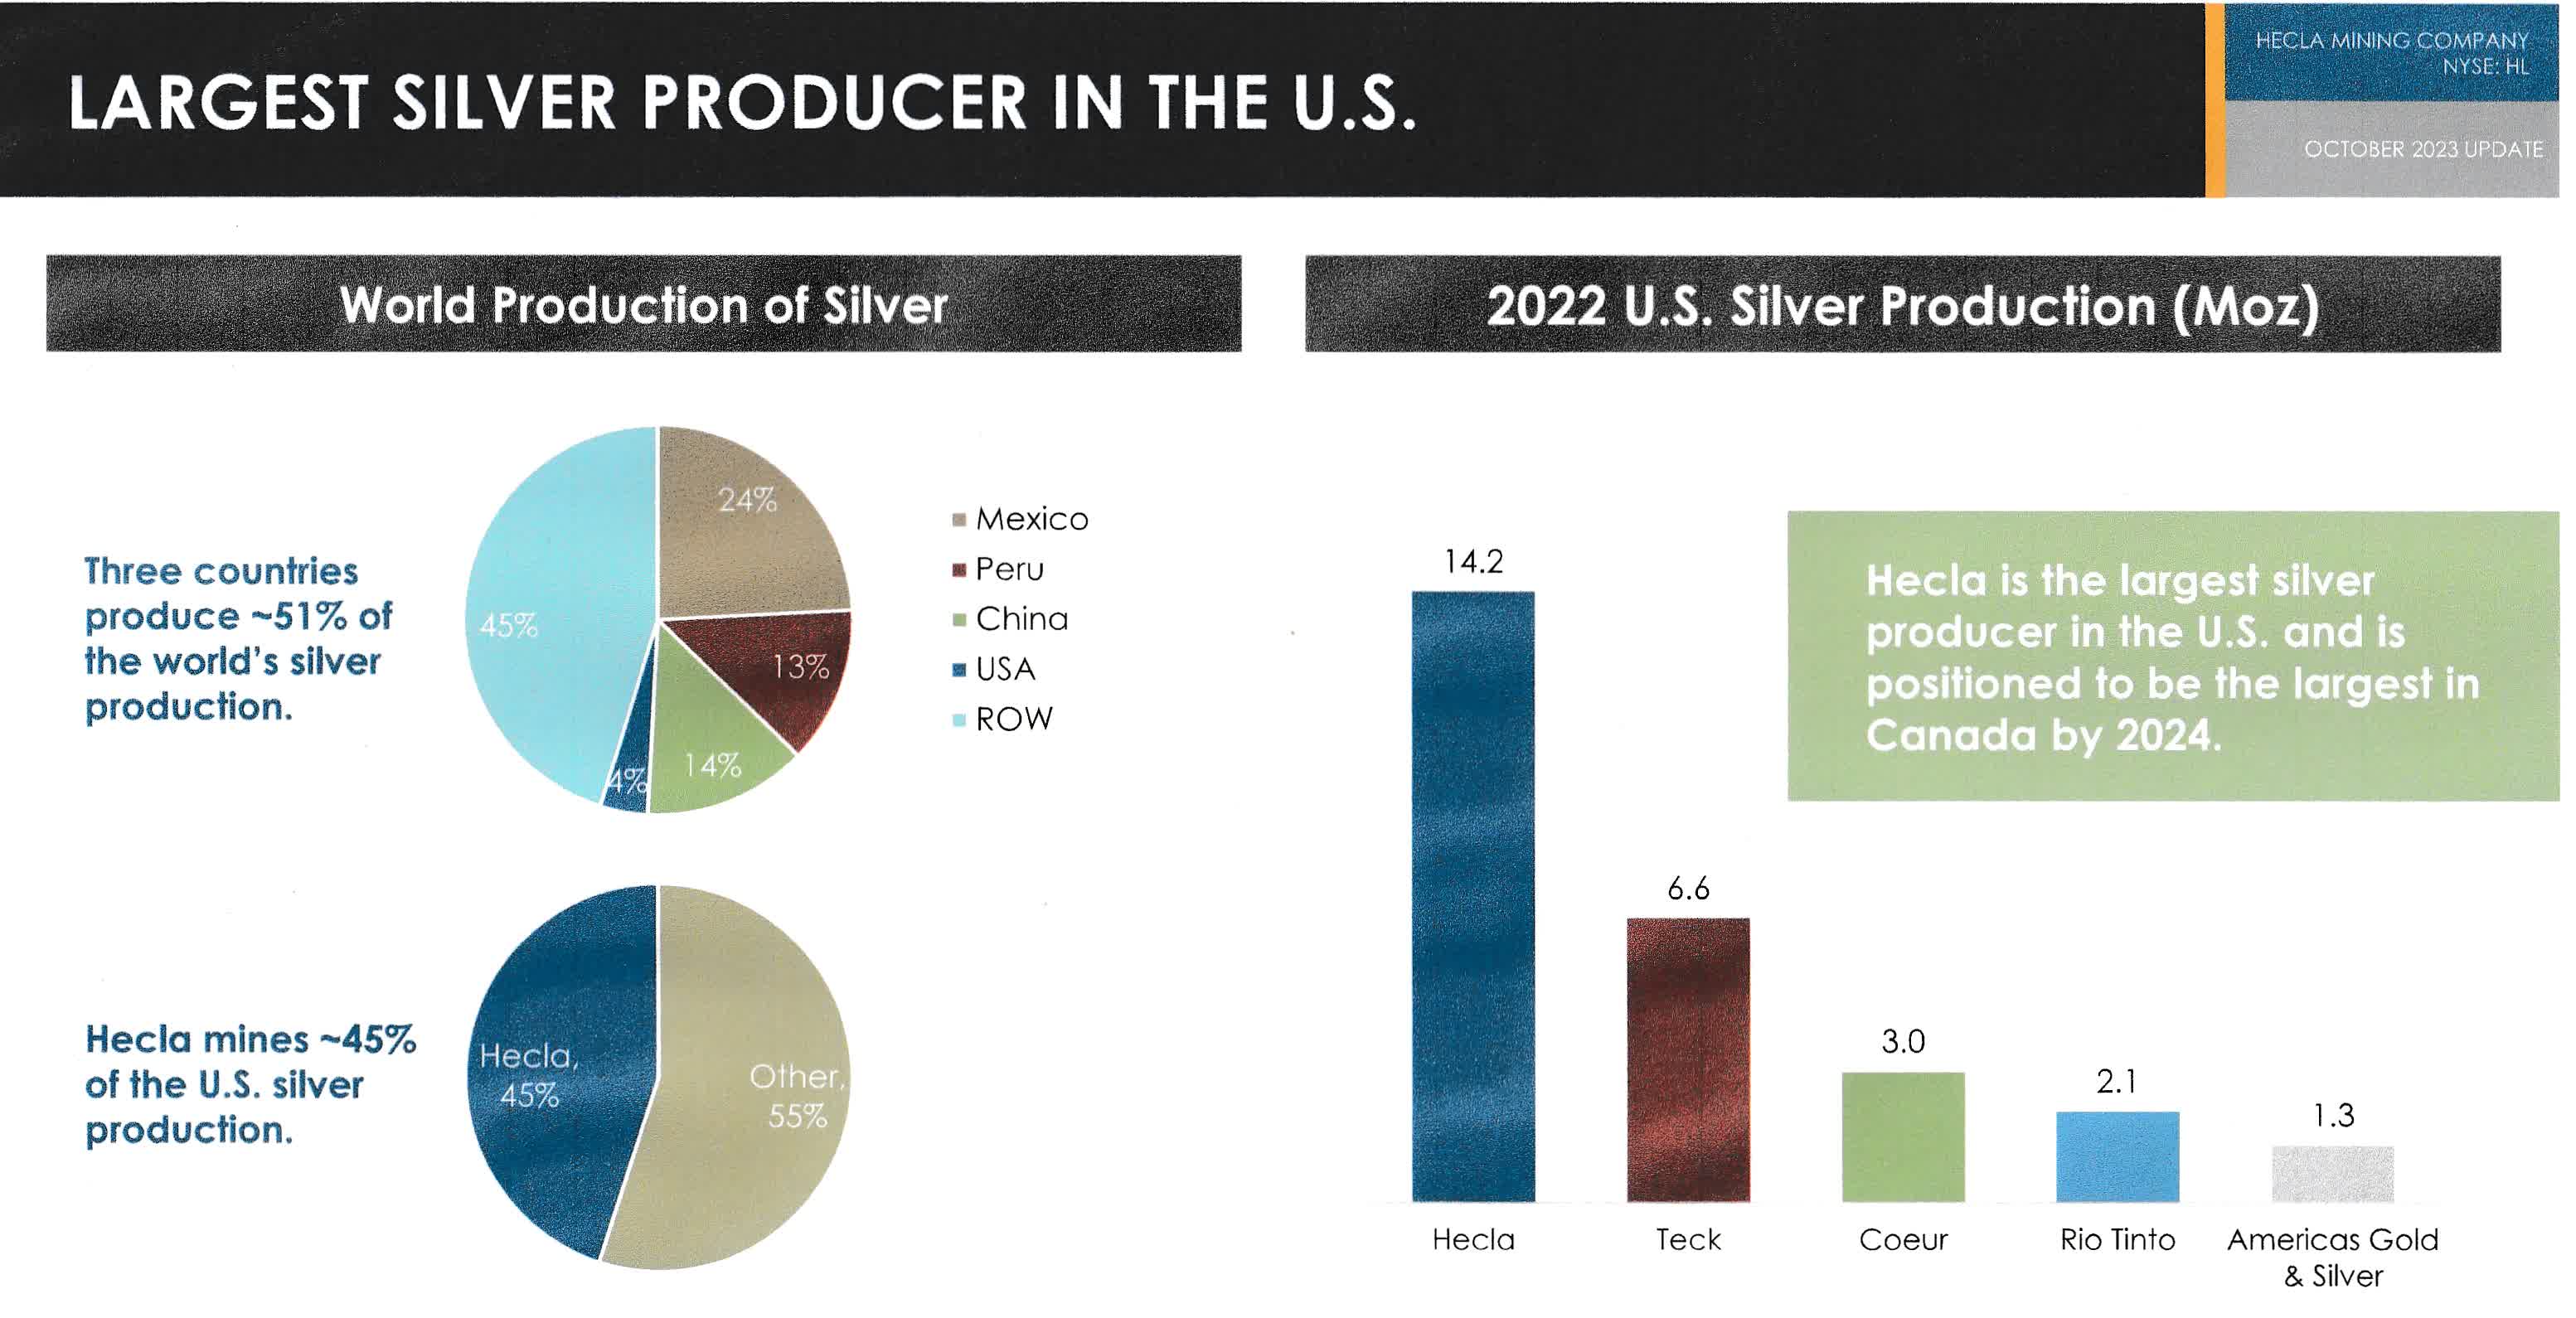
HL Silver Production Worldwide (HL Presentation October 2023 Update)
In 2022, Hecla Mining's gold revenues represented 41.6% of the total revenues, while the silver segment stood at 36.9%.
However, with the Production increasing in Keno Hill, Hecla Mining may change that starting in 2023.
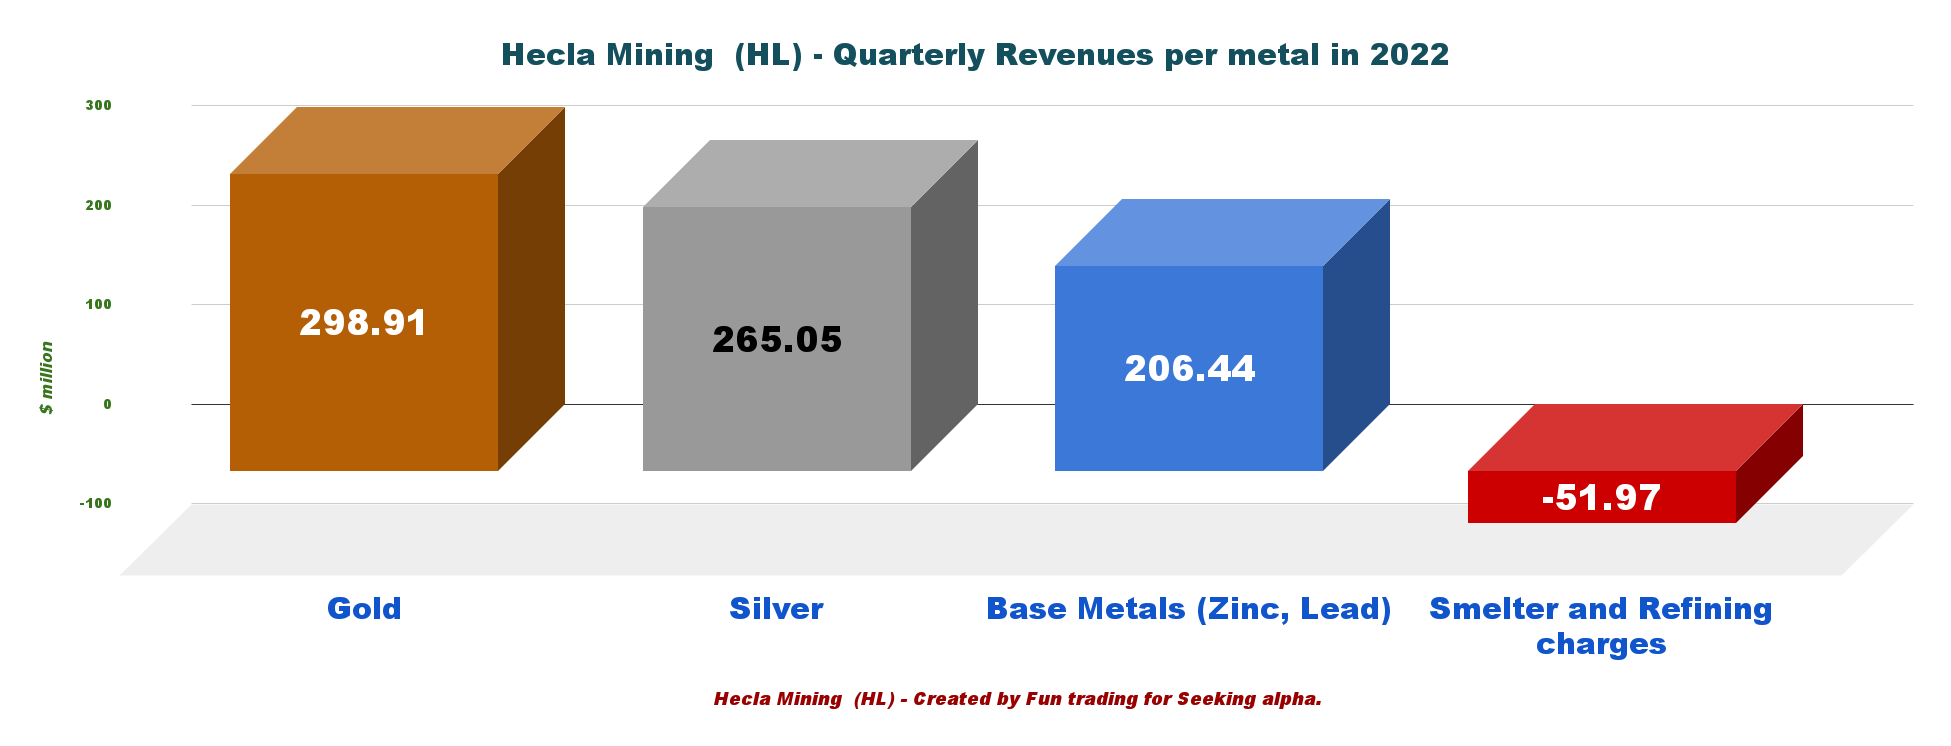
HL Production per Metal in 2022 (Fun Trading)
1 - Preliminary third-quarter Production snapshot
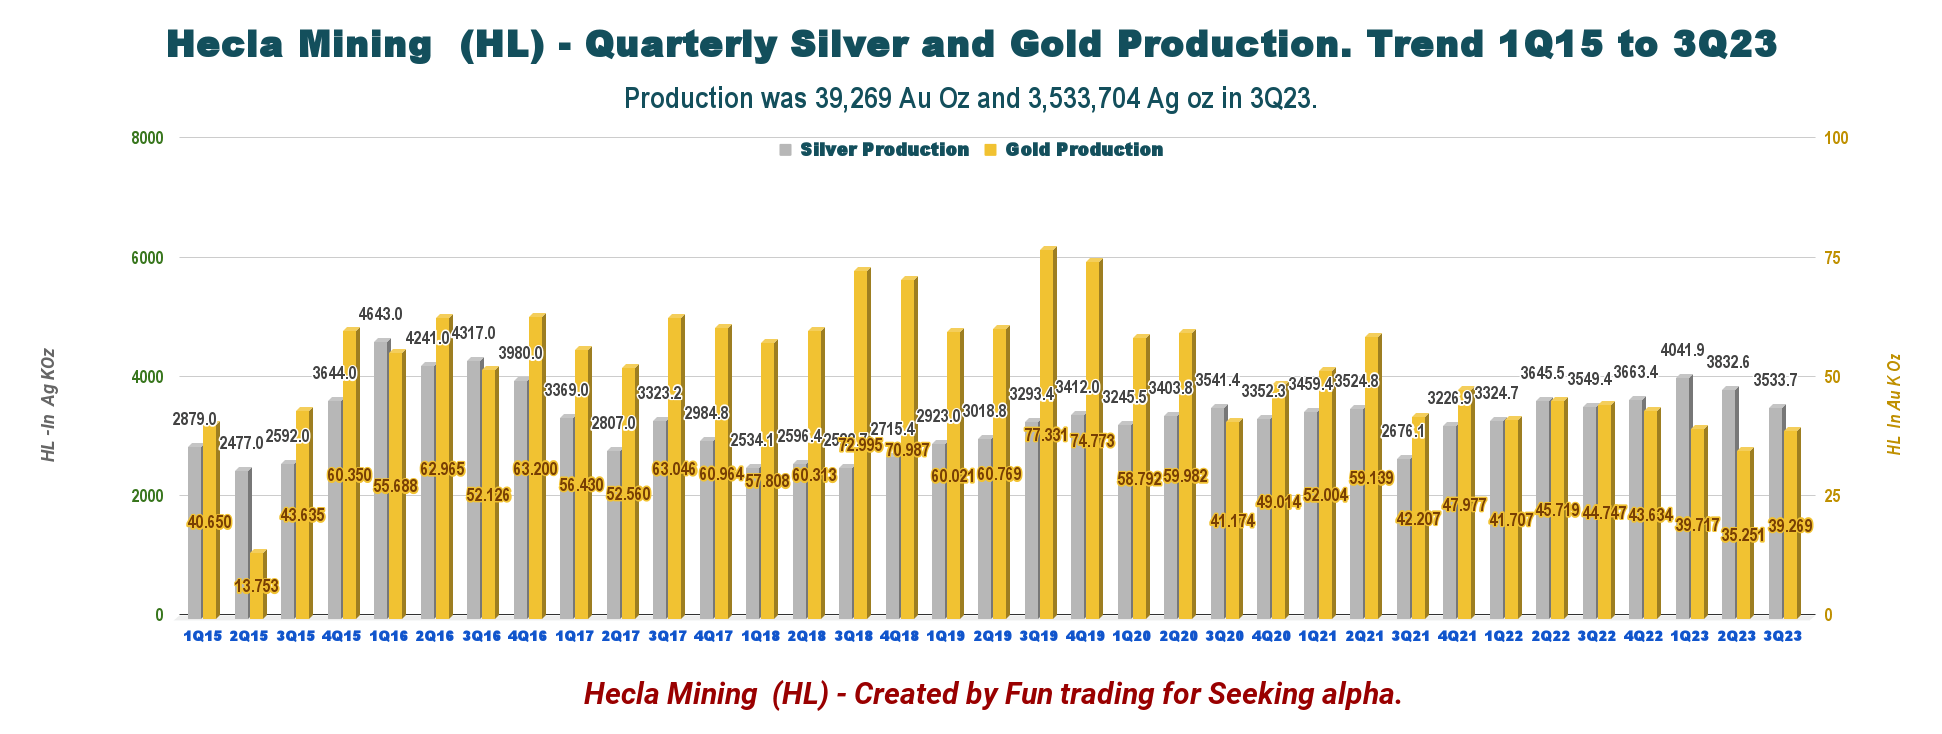
This quarter, Hecla Mining Company's gold and silver production was a mixed bag, with silver Production falling to 3.53 Moz, down 7.8% QoQ, even if gold production was up to 39,269 Oz, up 11.4% QoQ.
Phillips S. Baker, Jr., Hecla’s President and CEO, said in the press release (emphasis added):
Silver production continues to grow with almost a million ounces more this year compared to the first three quarters last year, despite less production at the Lucky Friday, Greens Creek’s consistent performance and the ramp-up of Keno Hill should allow us to be within our 2023 guidance of 14.5 to 15.5 million ounces.
The drop in Silver production was due to the Lucky Friday mine. Phillips S. Baker, Jr., said in the press release:
At Lucky Friday, we continue executing the plans to bring the mine back into production with no significant impact expected on 2024 production.
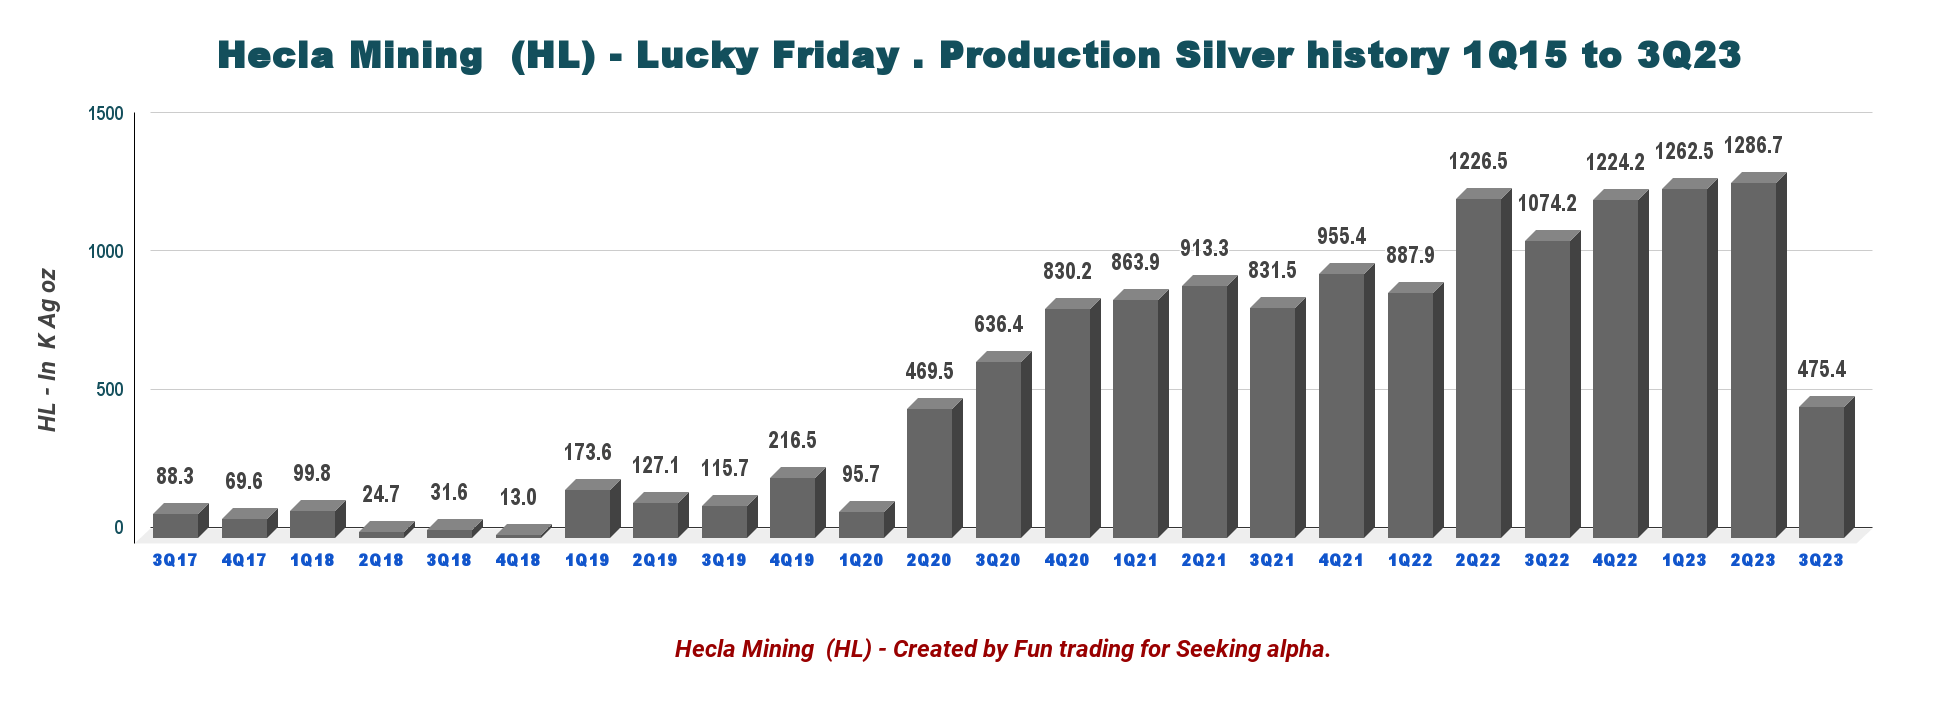
HL Quarterly Production at Lucky Friday History (Fun Trading)
On September 2023, Hecla Mining announced that it suspended Production at its Lucky Friday Mine in Mullan, Idaho, for the rest of the year as it modifies following a mine-shaft fire.
Hecla first reported the fire and a subsequent “fall of ground” at the mine in an Aug. 21 release. In its most recent update, the company said normal ventilation has been restored in the mine, and a project is underway to develop a new egress to bypass the damaged portion of the shaft. About 320 people work at Lucky Friday, and the company reports workers have been recalled.
Note: Property insurance policy covers up to $50 million and is expected to cover most of property damage and business interruption, less deductible ($0.5 million and business interruption is a 30-day dollar equivalent).
The company issued a Presentation update in October.
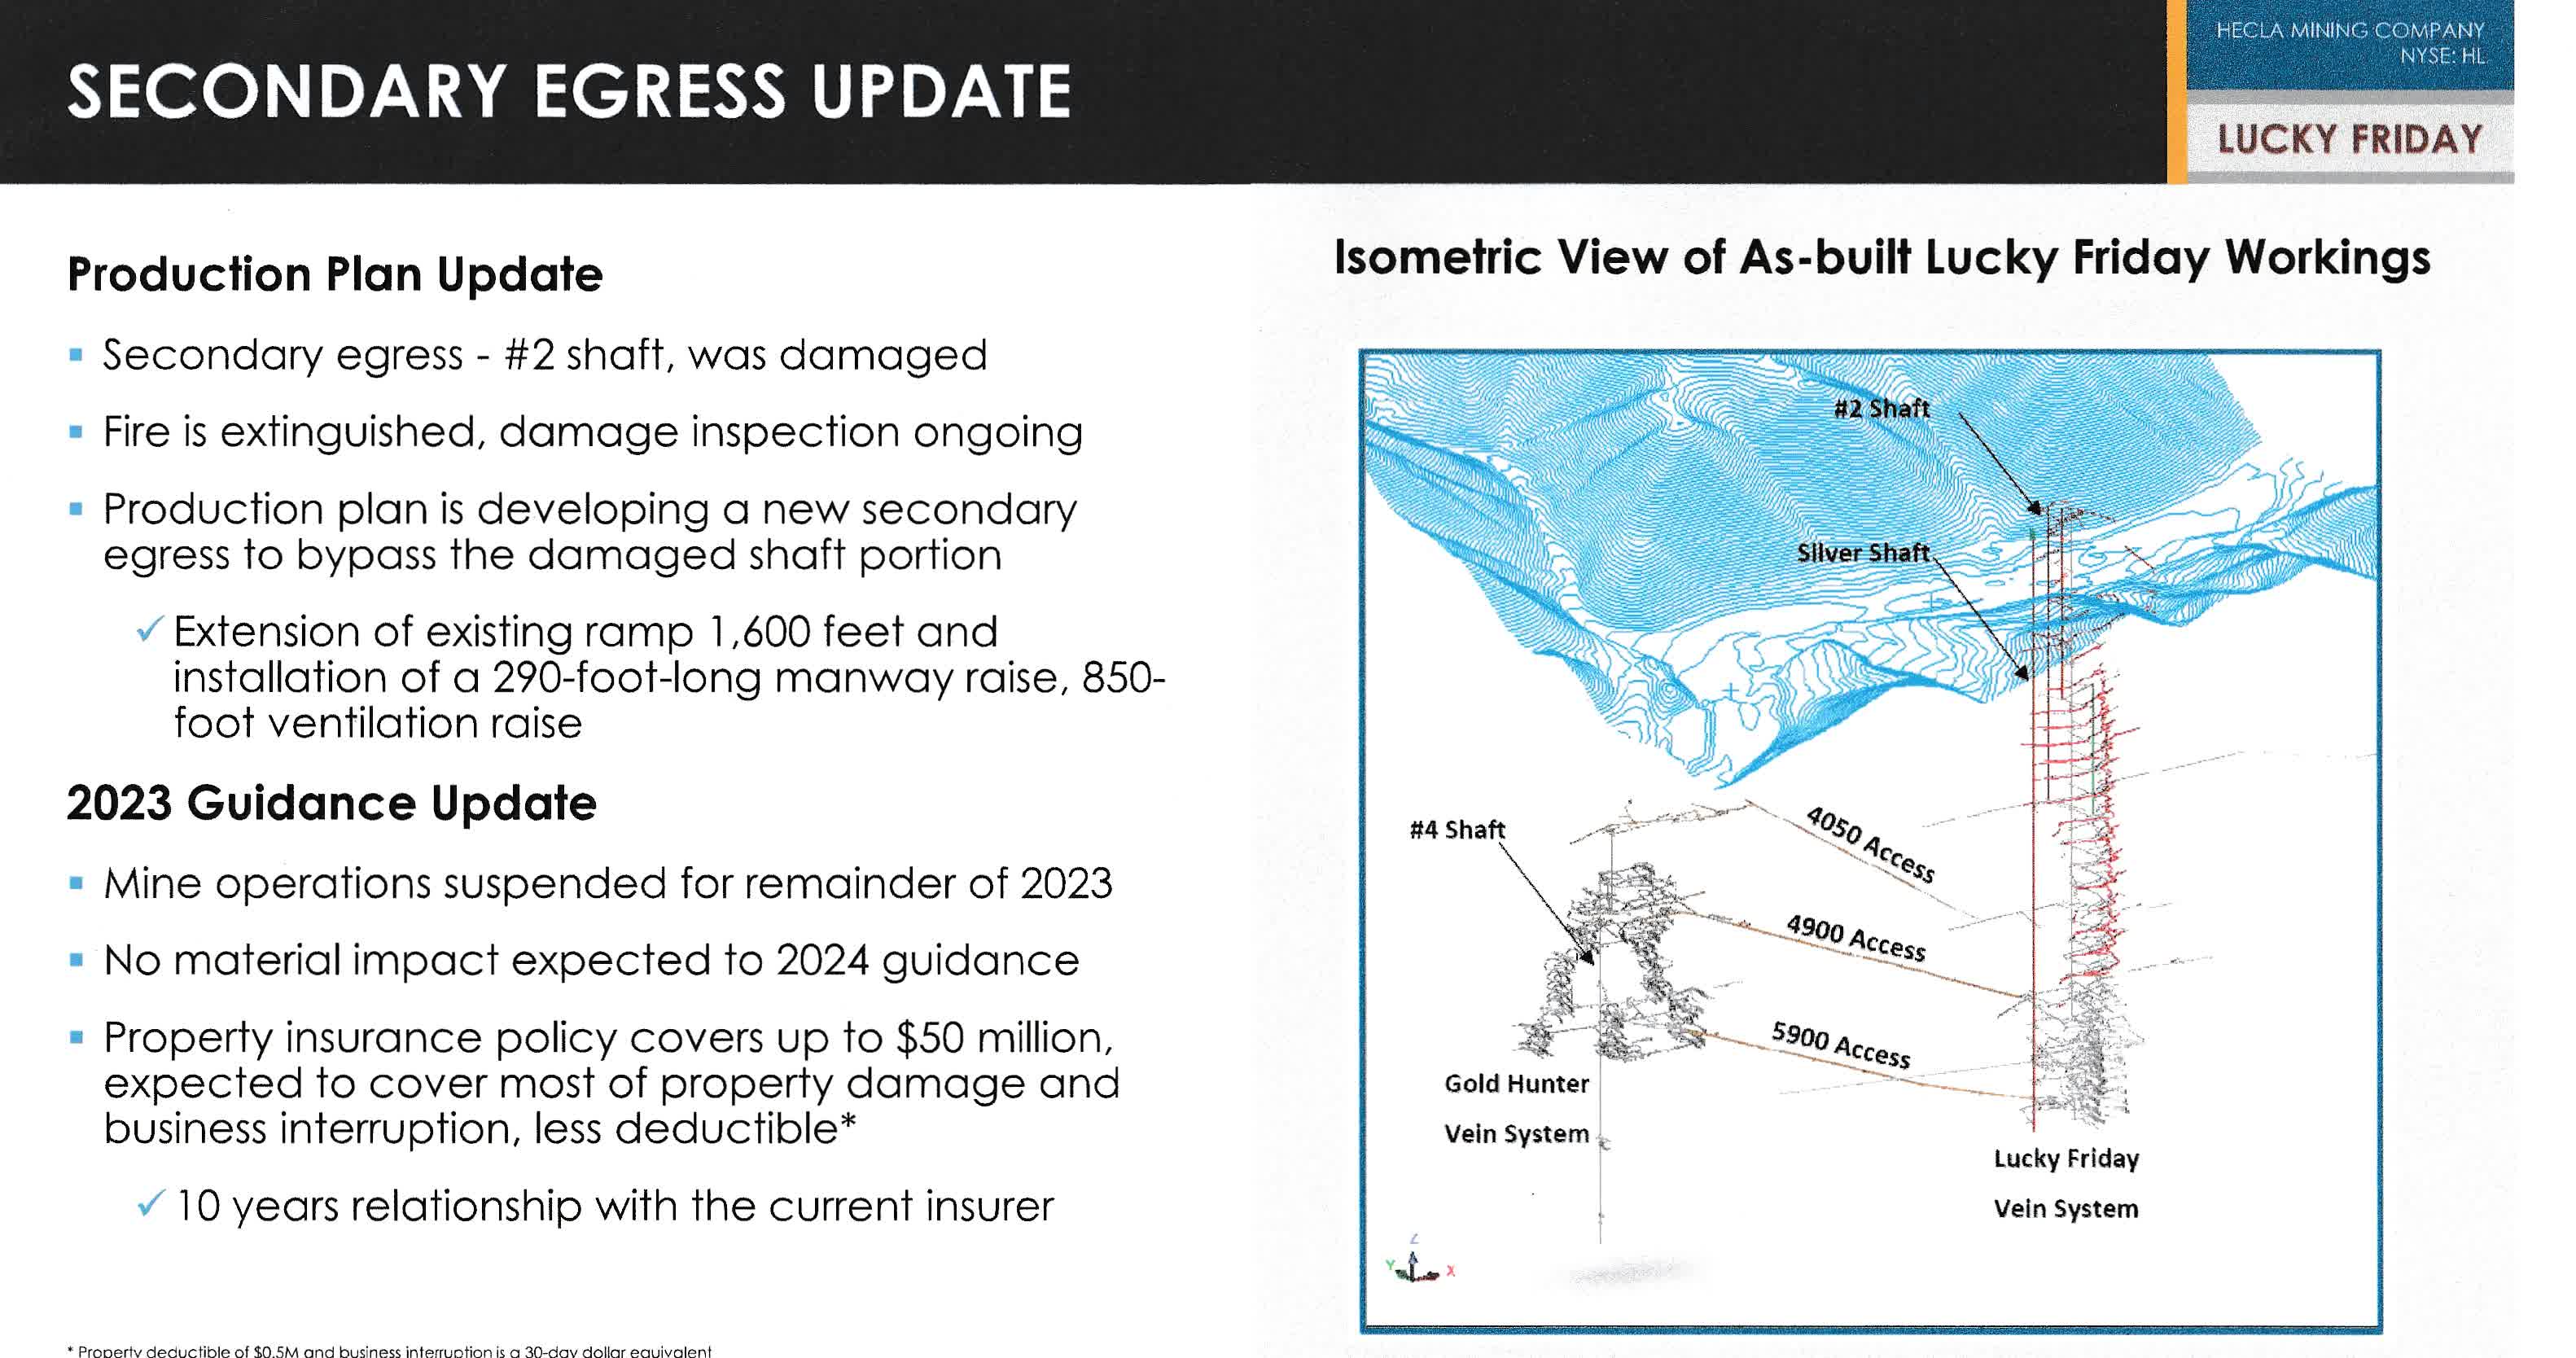
HL Lucky Friday Update (HL Presentation)
2 - Stock performance
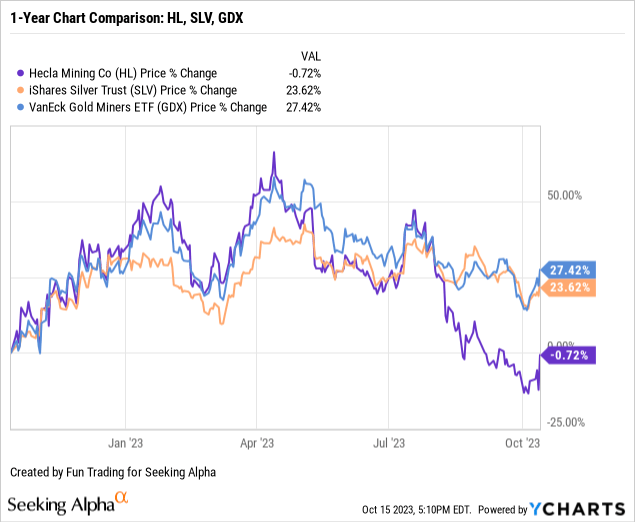
We can see that HL has underperformed the VanEck Vectors Gold Miners ETF (GDX) and the iShares Silver Trust (SLV) on a one-year basis.
Hecla Mining has dropped drastically since August 23 and is now down 0.7% on a one-year basis. The main reason for this underperformance is the issue encountered at Lucky Friday Mine.
 Data by YCharts
3 - Investment thesis
HL is a potential long-term investment but with a few important caveats.
Lucky Friday Mine is everything we can think about, but lucky. The company experienced many problems at the mine, from labor disputes in 2019-2020 to a devastating fire last month. It has been a serious thorn as long as I have covered the company.
Hopefully, this long darkness period will end in 2024, and Lucky Friday will finally deliver what management expects. On the other hand, Greens Creek had problems with ground support corrosion in 2018-2019 and lower grades.
Thus, I do not consider it a super-solid candidate for a long-term investment strategy. Still, I see an opportunity to look at the stock price and assume that Lucky Friday and the other mines will deliver without any more hiccups, which is perhaps a little too optimistic.
One safe solution is to trade HL short-term LIFO for about 80% of your position and accumulate a long-term position from the short-term gains de-risked. Two positives right now are the low stock price and, second, a potential rally in gold and silver in early 2024, assuming the FED will be about done with its rate increases.
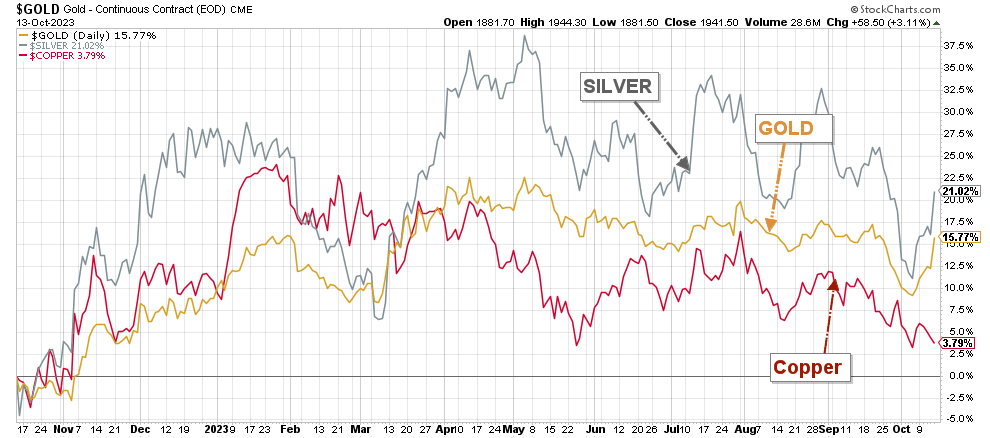
HL 1-Year Chart Gold, Silver, Copper (Fun Trading StoclCharts)
Hecla Mining - Company Balance Sheet History And Preliminary Production In 3Q23 - The Raw Numbers
| Hecla Mining | 2Q22 | 3Q22 | 4Q22 | 1Q23 | 2Q23 | 3Q23 |
| Sale Revenue and others in $ million | 191.24 | 146.34 | 194.35 | 199.50 | 178.13 | - |
| Net Income in $ million | -13.52 | -23.53 | -4.45 | -3.17 | -15.69 | - |
| EBITDA $ million | 35.44 | 10.91 | 41.04 | 50.13 | 34.50 | - |
| EPS diluted in $/share | -0.03 | -0.04 | 0.00 | -0.01 | -0.03 | - |
| Cash from operating activities in $ million | 40.18 | -24.32 | 36.12 | 40.60 | 23.78 | - |
| Capital Expenditure in $ million | 34.33 | 37.43 | 56.14 | 54.44 | 51.47 | - |
| Free Cash Flow In $ million | 5.85 | -61.75 | -20.02 | -13.84 | -27.69 | - |
| Total cash in $ million | 198.19 | 144.67 | 104.74 | 95.94 | 106.79 | - |
| Total debt in $ million | 534.54 | 530.75 | 517.74 | 516.96 | 559.82 | - |
| Dividend per share in $ | 0.00625 | 0.00375 | 0.00625 | 0.00625 | 0.00625 | - |
| Shares outstanding (diluted) in a million | 539.40 | 554.53 | 597.38 | 600.08 | 604.09 | - |
| Silver and Gold Production | 2Q22 | 3Q22 | 4Q22 | 1Q23 | 2Q23 | 3Q23 |
| Silver Production K Au Oz | 3,645 | 3,549 | 3,663 | 4,042 | 3.832.6 | 3,533.7 |
| Gold production K Ag Oz | 45.72 | 44.75 | 43.70 | 39.72 | 35.25 | 39.27 |
| Silver realized $/oz | 20.68 | 18.30 | 22.03 | 22.62 | 23.67 | - |
| Gold price realized $/oz | 1,865 | 1,713 | 1,757 | 1,902 | 1,969 | - |
| Ag AISC by-product | 8.08 | 12.93 | 13.98 | 8.96 | 11.63 | - |
Data Source: Company material.
Analysis: Silver And Gold Production Details For The third quarter Of 2023
1 - Total Silver/Gold production
For the third quarter, gold production was 39,269 Oz, and silver production was 3,533,704 Oz.
Lead production was 8,276 Tonnes, and Zinc production was 14,980 Tonnes in 3Q23.
It was a mixed-bag production due to the setback at Lucky Friday.
HL Quarterly Gold and Silver Production History (Fun Trading)
Details per mine are below:
Note: when we add the gold and silver production per mine, we do not get the total Production indicated by the company, as you can see below.
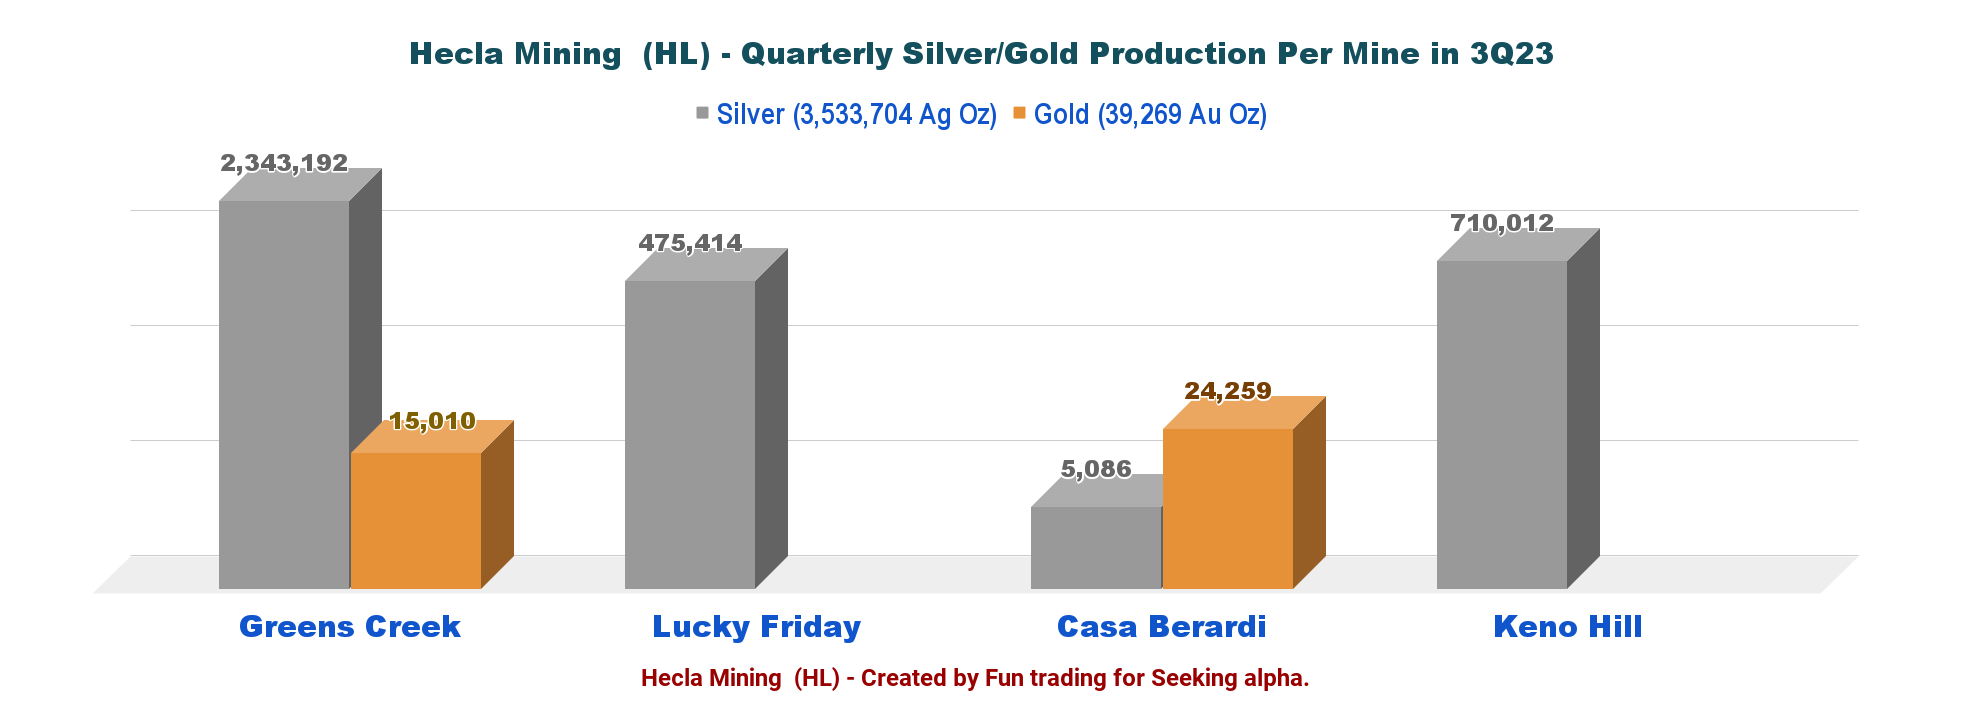
HL 3Q23 Production per Mine and per Metal (Fun Trading)
2 - 2023 Guidance revised lower after Lucky Friday Hiccup.
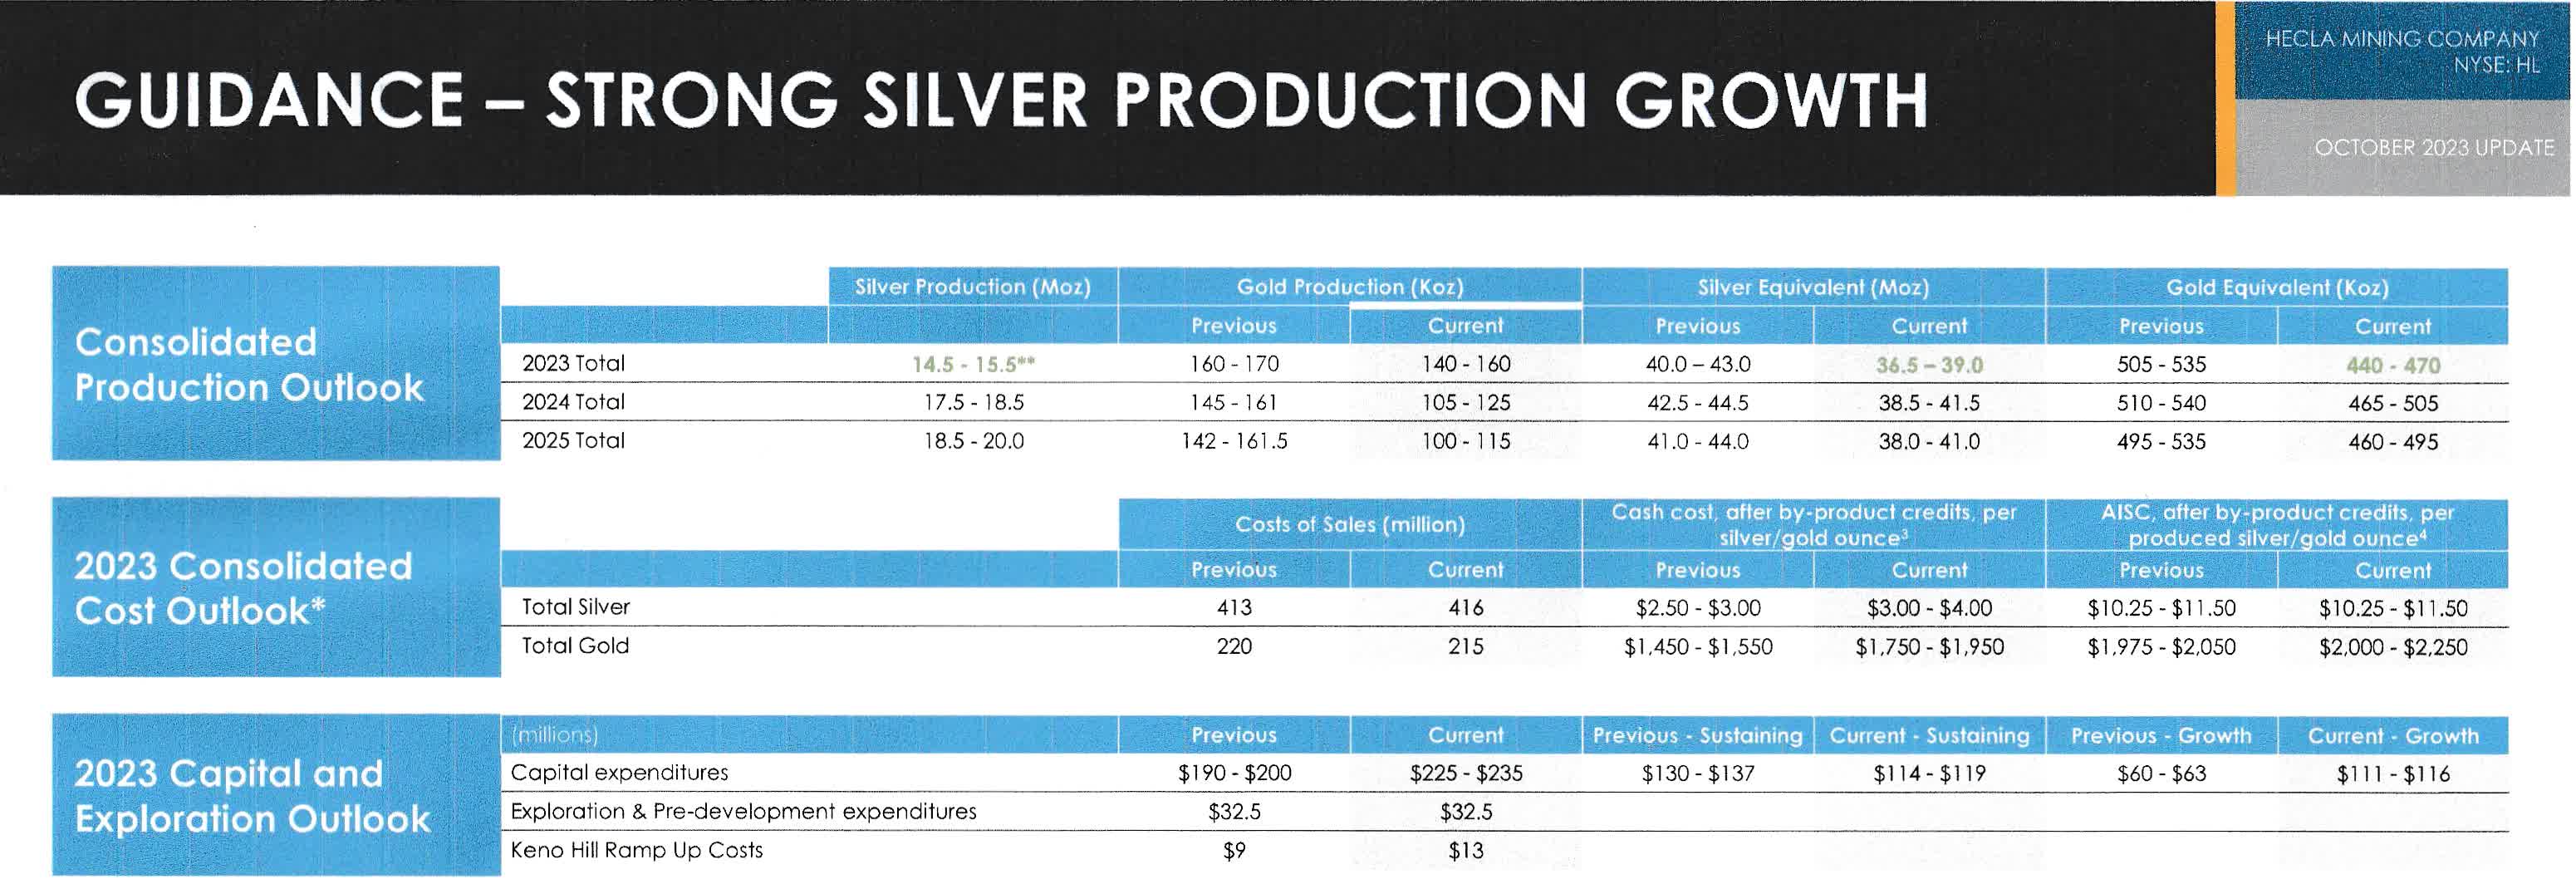
HL 2023 Guidance (HL Presentation October 2023)
Gold Production is now expected to be 140Koz-160Koz, down about 9.1% (mid-point) from prior guidance. The problem is that gold Production is expected to drop significantly in 2024 and 2025, down 24.8% and 29.2%.
Silver Production is now expected to be 14.5 Moz and 15.5 Moz in 2023, increasing to 17.5 Moz and 18.5 Moz in 2024 and 18.5 Moz and 20.0 Moz in 2025.
In Silver Equivalent 2023, Production is down 9% to 36.5 Moz and 39.0 Moz, with 38.5Moz-41.5Moz in 2024 and 38.0Moz-41.0Moz in 2025.
Technical Analysis and Commentary
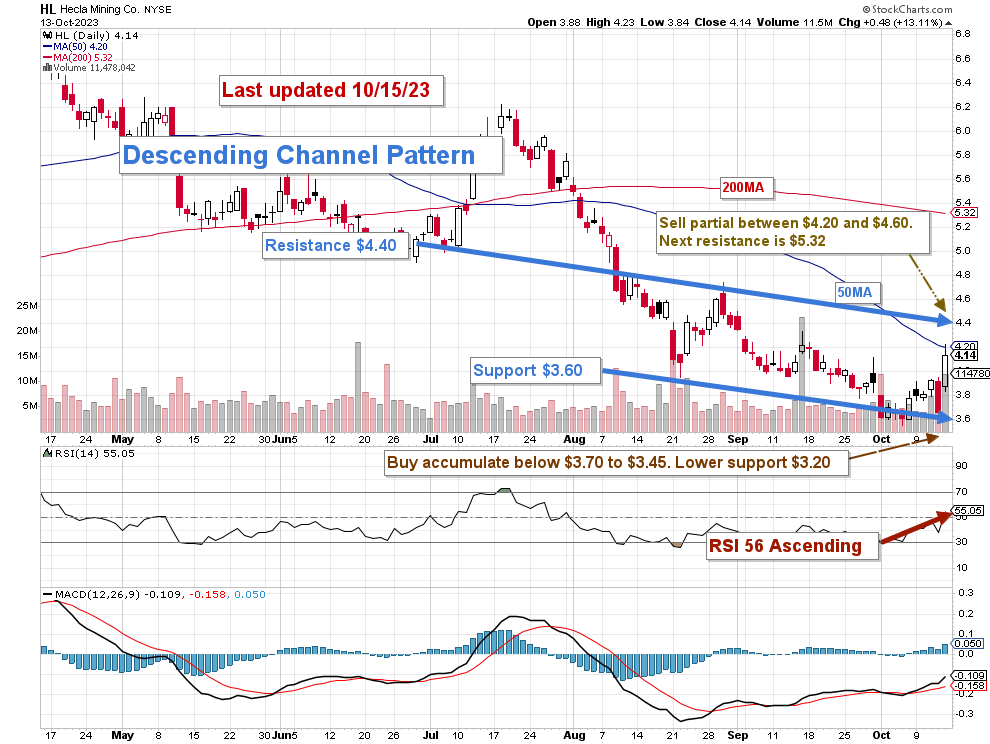
HL TA Chart (Fun Trading StockCharts)
Note: the chart is adjusted for dividends.
HL forms a descending channel pattern with resistance at $4.40 and support at $3.60.
Descending channel patterns are short-term bearish in that a stock moves lower within a descending channel, but they often form within longer-term uptrends as continuation patterns. Higher prices usually follow The descending channel pattern but only after an upside penetration of the upper trend line.
The trading strategy I suggest is to sell about 80% between $4.20 and $5.60 with higher resistance at $5.32. Conversely, I believe it is safe to accumulate HL between $3.70 and $3.45 with lower support at $3.20.
Thus, watch the gold and silver prices like a hawk.
Warning: The TA chart must be updated frequently to be relevant. It is what I am doing in my stock tracker. The chart above has a possible validity of about a week. Remember, the TA chart is a tool only to help you adopt the right strategy. It is not a way to foresee the future. No one and nothing can.
Disclaimer: Investing carries risk. This is not financial advice. The above content should not be regarded as an offer, recommendation, or solicitation on acquiring or disposing of any financial products, any associated discussions, comments, or posts by author or other users should not be considered as such either. It is solely for general information purpose only, which does not consider your own investment objectives, financial situations or needs. TTM assumes no responsibility or warranty for the accuracy and completeness of the information, investors should do their own research and may seek professional advice before investing.
