Schlumberger: A Strong Quarter With Optimistic Prospects
Summary
- Schlumberger Limited exceeded analyst expectations with Q3 2023 adjusted earnings of $0.78 per share and total quarterly revenues of $8,310 million.
- The company's strong performance was driven by increased sales of drilling and oilfield equipment internationally, particularly in the Middle East.
- Schlumberger plans to meet its goal of mid-20% growth in adjusted EBITDA by 2023 and give back $2 billion to shareholders through stock buybacks and dividends.
JHVEPhoto
Introduction
Houston-based Schlumberger Limited (NYSE:SLB) released its third quarter 2023 results on October 20, 2023.
Note: As indicated regularly, I have followed SLB quarterly since December 2018. This article updates my article published on July 26, 2023.
1: 2Q23 Results Snapshot
SLB again exceeded analyst expectations with third-quarter 2023 adjusted earnings of $0.78 per share. It significantly increased from $0.63 per share a year ago.
In addition, Schlumberger posted total quarterly revenues of $8,310 million, up from the year-ago quarter's $7,477 million.
Stronger sales of drilling and oilfield equipment internationally more than offset lower demand in North America, allowing Schlumberger to surpass analysts' expectations for quarterly profits.
80.2% of SLB's revenue comes from markets outside the United States, and the company has profited from increased production and exploration, particularly in the Middle East. Its revenue from this region makes up about 34% of its total revenue.
Schlumberger's board of directors approved a quarterly cash dividend of $0.25 per share.
CEO Olivier Le Peuch said in the conference call:
Our third quarter results have built upon the positive momentum we established in the first half of the year and firmly position us to achieve our full year financial ambitions. We continued to grow revenue and adjusted EBITDA both sequentially and year-on-year, and we generated free cash flow of $1 billion for the second consecutive quarter.
2: Investment Thesis
In the oilfield services industry, Schlumberger Limited is my top choice because of its strong track record and global experience.
Schlumberger's third-quarter revenues exceeded analyst expectations, resulting in a strong set of results. SLB performed particularly well in international markets. Strong sales internationally, particularly in the company's traditional centers of Asia and the Middle East, were the primary driver of the impressive performance.
The company is on track to meet its goal of mid-20% growth in adjusted EBITDA by the year 2023. Thanks to increased working capital and robust cash flow, Schlumberger plans to carry out its stock buyback program and give back about $2 billion to shareholders this year.
In addition, the industry is now increasingly bullish because of an upbeat oil environment, but it could quickly turn south if any signs of weakness appear. There are alarming signs of unrest in the Middle East.
Zacks predicts a +11.5% year-over-year change in sales from the current consensus estimate of $8.78 billion for the upcoming quarter. It projects about $35.1 billion for the fiscal year 2023, which is impressive. But I worry that the price has already accounted for the majority of the benefits.
SLB CEO Olivier Le Peuch said in the press release:
Looking ahead, we believe the market fundamentals remain very compelling for our business. The oil and gas industry continues to benefit from a multiyear growth cycle that has shifted to the international and offshore markets where we are the clear leader. Concurrently, upstream spending is accelerating as operators continue to invest in long-cycle developments, production capacity expansions, exploration and appraisal, and enhanced gas production.
In such a volatile environment, trading LIFO around a long-term position is therefore advised. The most common trading strategy for cyclical services stocks is to trade 50% of the entire position. This is especially true for SLB, whose valuation has reached a frosty level.
3: Stock Performance
As can be seen below, over the course of a year, Baker Hughes has outperformed Schlumberger and Halliburton by a significant margin. SLB has increased 11% over the past year, though.
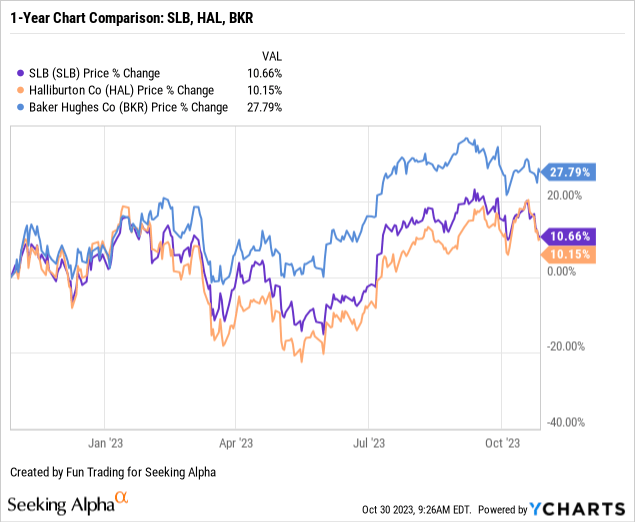 Data by YCharts
Schlumberger Financials History: Ending Q3 2023 Trend And Raw Numbers
| Schlumberger | 3Q22 |
4Q22 |
1Q23 |
2Q23 |
3Q23 |
| Total Revenues in Billions | 7.48 | 7.88 | 7.74 | 8.10 | 8.31 |
| Net income in millions | 907 |
1,064 |
934 |
1,033 |
1,123 |
| EBITDA $ Million | 1,256 | 1,539 | 1,841 | 1,981 | 2,103 |
| EPS diluted in $/share | 0.63 |
0.74 |
0.65 |
0.72 |
0.78 |
| Cash flow from operating activities in the millions | 1,567 | 1,614 | 330 | 1,608 | 1,677 |
| CapEx in $ Million | 382 | 669 | 410 | 471 | 585 |
| Free cash flow in the millions | 1,185 | 945 | -80 | 1,137 | 1,092 |
| Total cash: $ Billion | 3.61 | 2.89 | 2.50 | 3.19 | 3.74 |
| Total LT Debt in $ Billion | 13.35 | 13.23 | 12.84 | 13.34 | 13.15 |
| Dividend per share in $ | 0.175 | 0.25 | 0.25 | 0.25 | 0.25 |
| Shares Outstanding (Diluted) in Millions | 1,414 | 1,440 | 1,446 | 1,442 | 1,442 |
Source: Company release.
Revenues, Free Cash Flow, And Debt Analysis
1: Quarterly Revenues were $8.310 billion at the end of September 2023
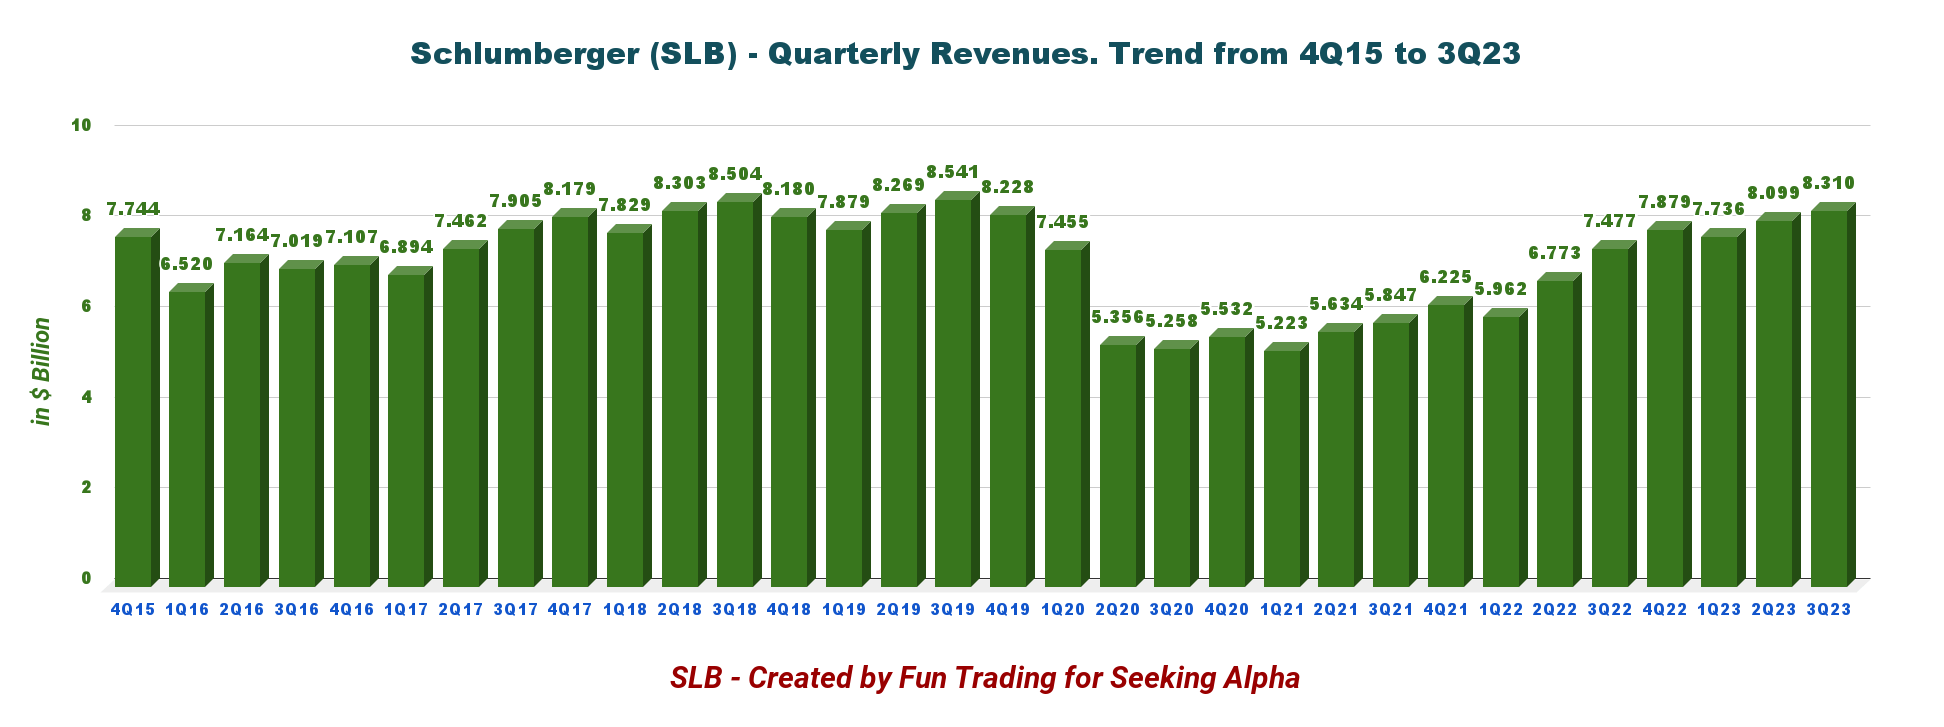
SLB Quarterly Revenue History (Fun Trading)
Schlumberger reported revenue of $8.310 billion in Q3 2023, or an 11.1% increase YoY, while up 2.6% from the previous quarter. Net income was $1,123 million, or $0.78 per diluted share, compared with $907 million, or $0.63 per share, in 3Q22.
Adjusted earnings were $0.78 per share, which beat analysts' expectations, and adjusted EBITDA was $2,081 million.
CFO Stephane Biguet said in the conference call:
International sequential revenue growth of 5% was led by the Middle East and Asia, which increased 8% while North America revenue decreased 6%. Sequentially, the pre-tax segment operating margin increased 73 basis points, which resulted in incremental margins of 48% largely due to the high-quality international revenue. Company-wide adjusted EBITDA margin for the third quarter reached 25%, the highest level since 2015.
1.1 Revenue per Region
Sales grew 2.6% sequentially as a result of the international business. However, as the graph below illustrates, the revenue QoQ for the North American segment was slightly lower:
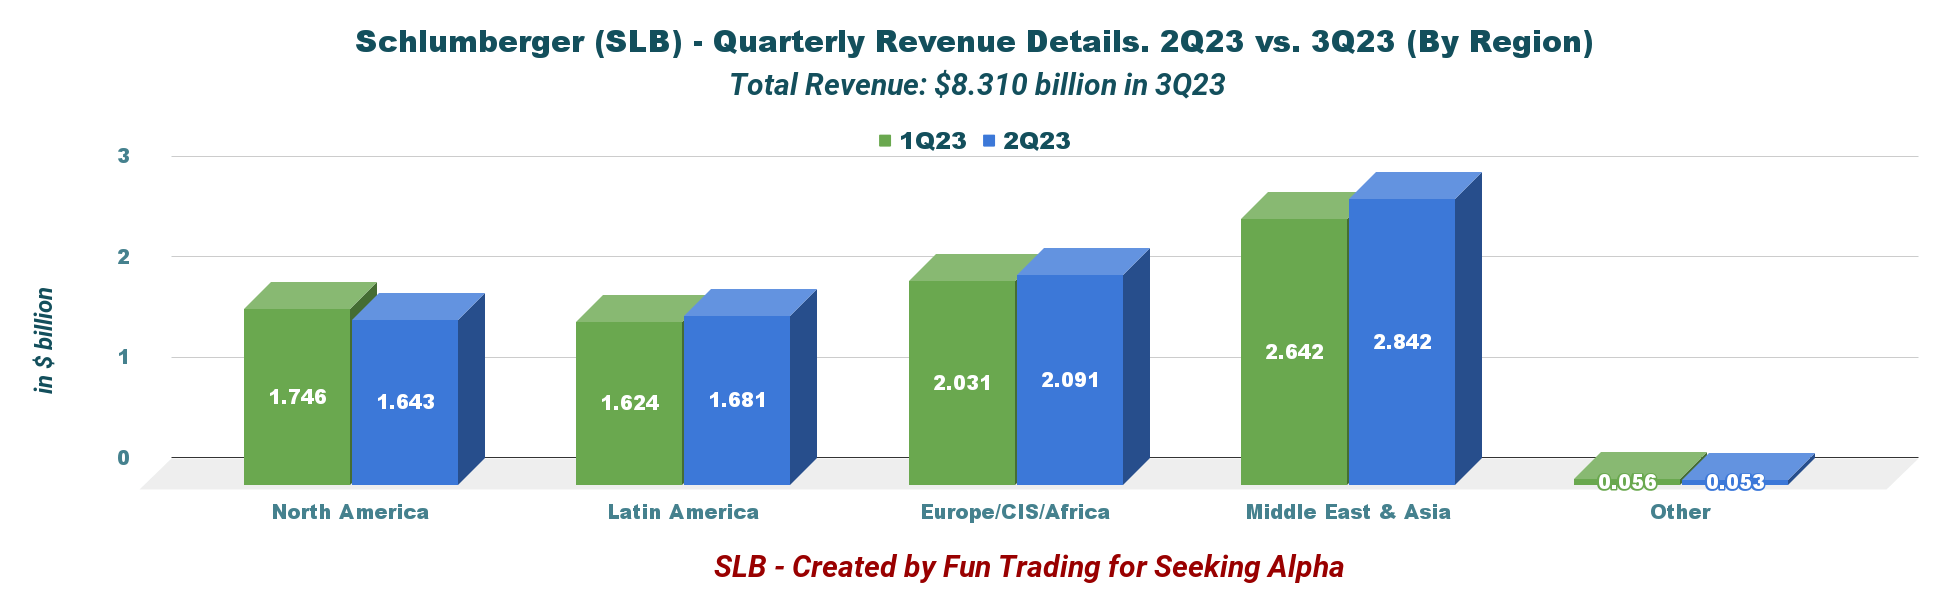
SLB 2Q23 versus 3Q23 Revenue per Region (Fun Trading)
The regions with the highest revenue generation are Europe/Africa and the Middle East/Asia. Just 19.8% of the total revenue comes from North America.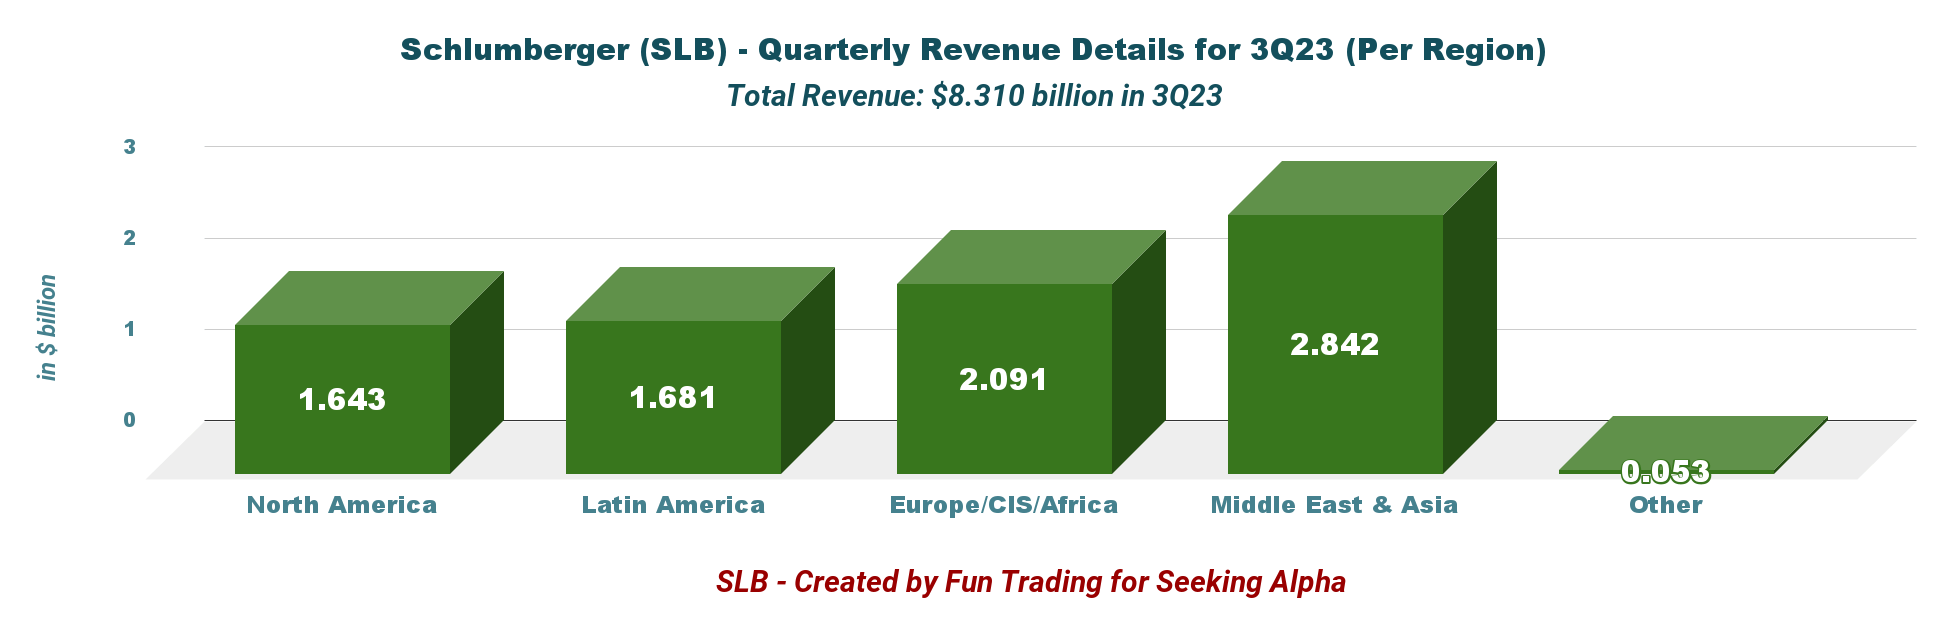
SLB 3Q23 Revenue per Region (Fun Trading)
1.2: Revenue per segment
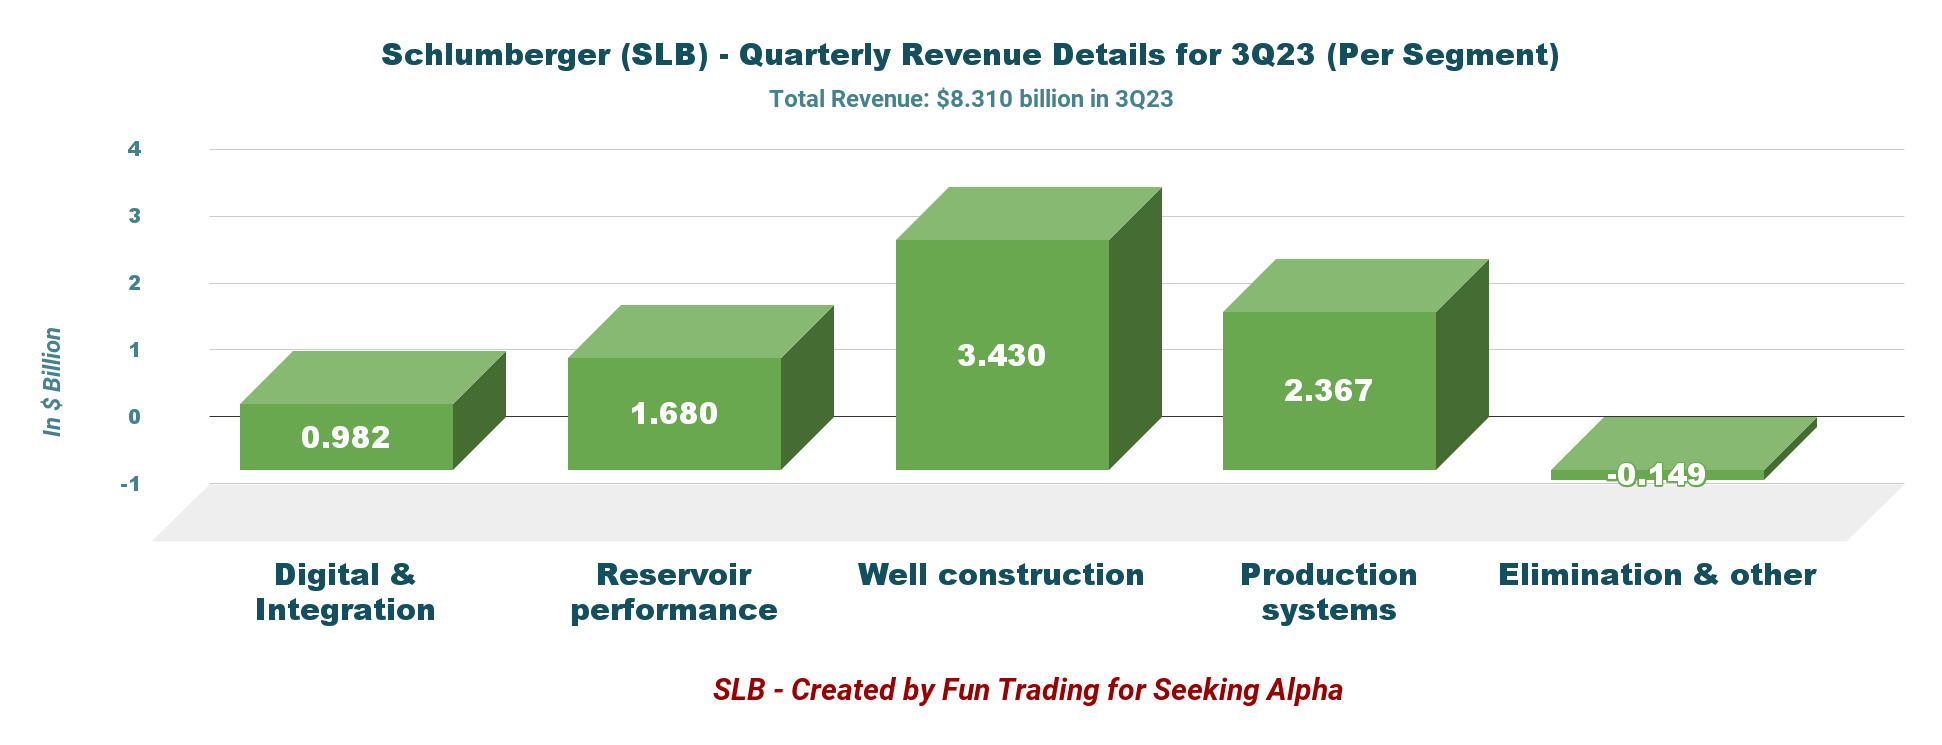
SLB 3Q23 Revenue per Segment (Fun Trading)
As we can see above, the Well Construction segment is the most significant for the business, accounting for 41.3% of the company's revenue.2: The Free Cash Flow was $1,092 million in 3Q23
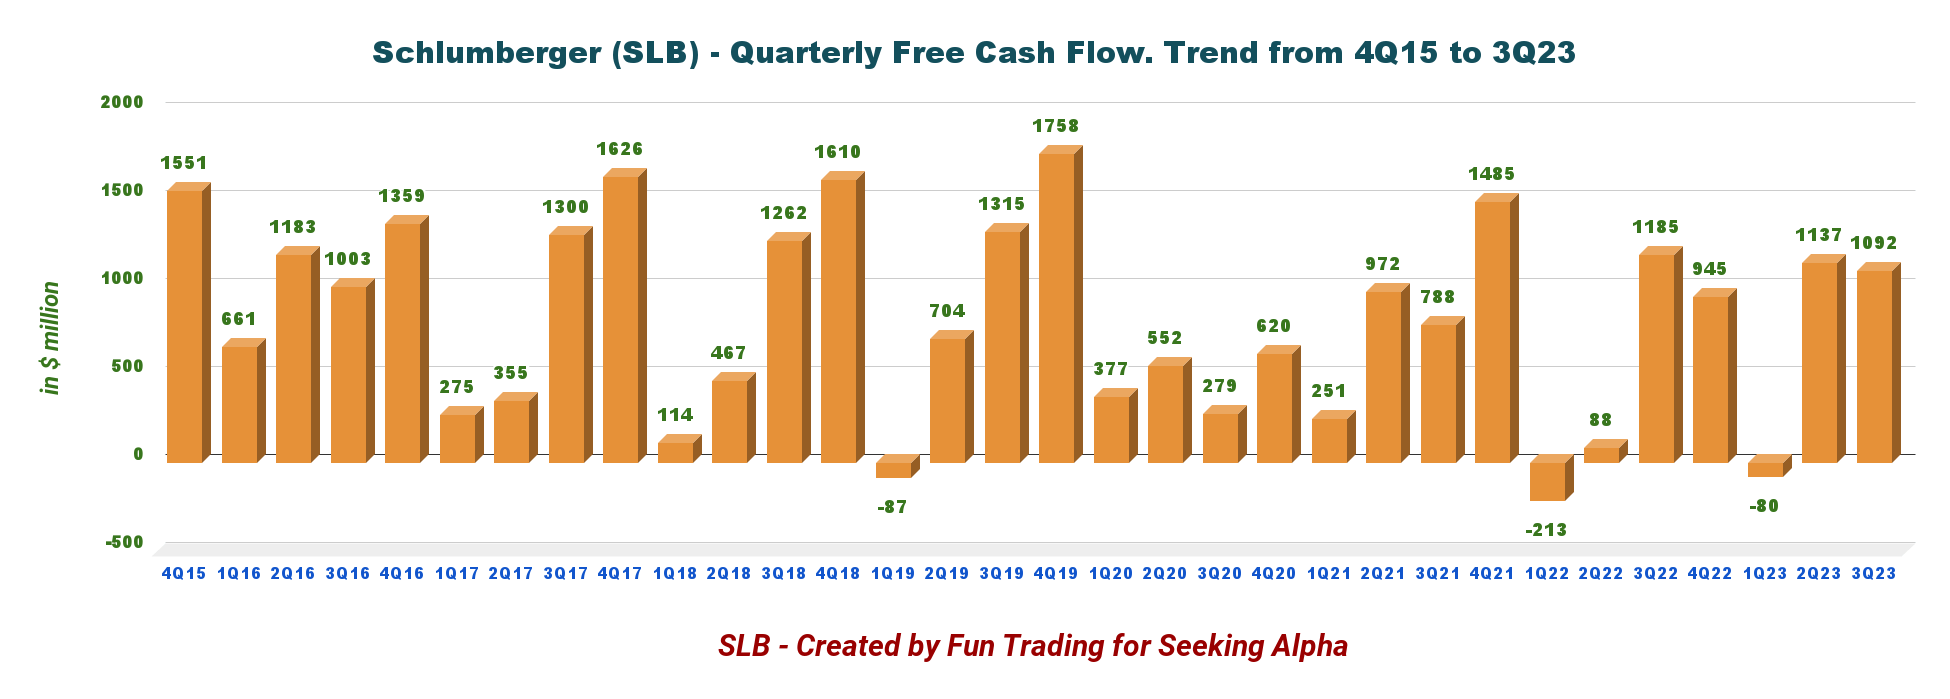
SLB Quarterly Free Cash Flow History (Fun Trading)
Note: The cash from operating activities less capital expenditures is the generic free cash flow. Schlumberger came at a different figure of $1,037 million for the FCF. Schlumberger used capital expenditures of $640 million with investments in APS projects and multi-client.
Trailing 12-month free cash flow was $3,171 million, and 3Q23 free cash flow was $1,092 million from $1,108 million in 3Q22.
Considering how solid the company's fundamentals are, I think the $0.25 quarterly cash dividend per share, or 1.70% dividend yield, approved by Schlumberger's board of directors is too little and should be raised in 2024.
SLB paid $151 million in total to buy back 2.6 million shares of its common stock during the quarter, with each share costing $57.46 on average.
3: Net Debt increased sequentially to $9.41 billion at the end of September 2023. Good progress.
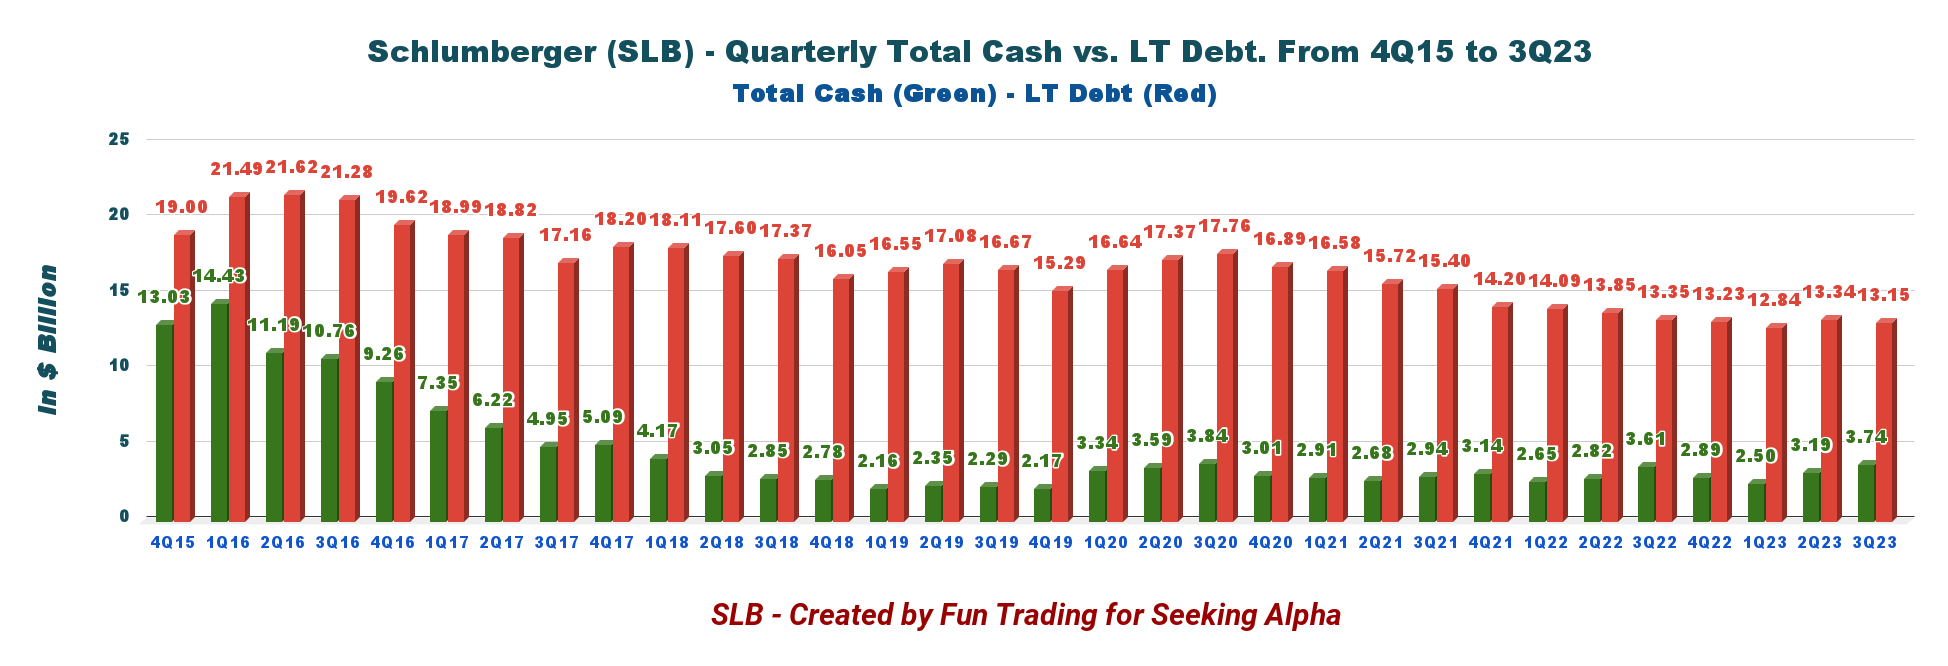
SLB Quarterly Cash versus Debt History (Fun Trading)
The long-term debt (including current) was $13,145 million at the end of September 2023, down from $13,351 million in 3Q22. Cash was $3,735 million this quarter.
CFO Stephane Biguet said in the conference call (emphasis added):
As a result of this strong cash flow performance, our net debt was reduced sequentially by $731 million to $9.4 billion. Our net debt to trailing 12-month EBITDA leverage ratio of 1.2 is at its lowest level since 2015.
Technical Analysis and Commentary (SLB)
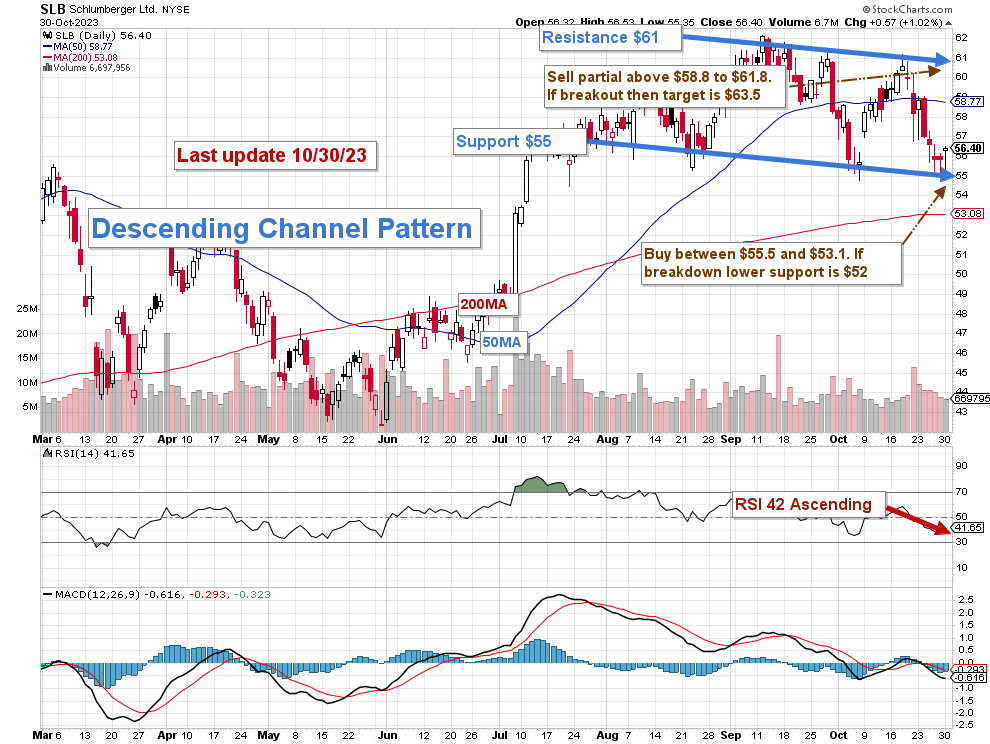
SLB TA Chart (Fun Trading StockCharts)
Note: The chart has been adjusted for dividends.
SLB develops a descending channel pattern, with support at $55 and resistance at $61. The RSI of 38 indicates that there may be an oversold scenario coming soon and that it is almost time to consider increasing your position.
Descending channel patterns are short-term bearish in that a stock moves lower within a descending channel, but they often form within longer-term uptrends as continuation patterns. Higher prices usually follow The descending channel pattern but only after an upside penetration of the upper trend line.
According to my investing thesis, you should trade about half of your position in short-term LIFO. I suggest selling in part between $58.8 and $61.8 in the event of robust momentum, with $63.5 serving as a possible higher resistance. However, if the stock declines between $55.5 and $53.1, it would be wise to make a purchase, with $52 possibly representing a lower support level.
One great way to trade your long-core position is to use the LIFO strategy. It implies that you are holding onto your oldest position to move forward while selling off your most recent purchases. It will substantially lower your risk while rewarding you with a much higher profit.
Warning: The TA chart must be updated frequently to be relevant. The chart above has a possible validity of about a week. Remember, the TA chart is a tool only to help you adopt the right strategy. It is not a way to foresee the future. No one and nothing can.
Disclaimer: Investing carries risk. This is not financial advice. The above content should not be regarded as an offer, recommendation, or solicitation on acquiring or disposing of any financial products, any associated discussions, comments, or posts by author or other users should not be considered as such either. It is solely for general information purpose only, which does not consider your own investment objectives, financial situations or needs. TTM assumes no responsibility or warranty for the accuracy and completeness of the information, investors should do their own research and may seek professional advice before investing.
