Alamos Gold: FY23 Guidance Up 5%
Summary
- Alamos Gold Inc. reported strong third-quarter results, with production exceeding guidance and costs near the low end of annual guidance.
- The company posted record revenues of $256.2 million in 3Q23 and a net income of $39.4 million.
- AGI raised its production guidance for 2023 by 5% and is on track to achieve a new annual record.
- I recommend buying AGI between $12.10 and $11.80, with possible lower support at $11.25.
bodnarchuk
Introduction
The Toronto-based Alamos Gold Inc. (NYSE:AGI) released its third-quarter results on October 25, 2023.
Note: This article updates my article published on July 31, 2023. I have followed AGI on Seeking Alpha since August 2017.
President and CEO John McCluskey said in the conference call:
We delivered another strong quarter with production of 135,400 ounces, exceeding quarterly guidance at costs near the low end of annual guidance. This reflected a solid quarter from Island Gold, and another excellent quarter from the La Yaqui Grande. With year-to-date to the production of 400,000 ounces, we are on pace to achieve a new annual record driven by an outstanding year from the Mulatos district. Given the strong performance we are increasing our production guidance by 5% to a new range of 515,000 to 530,000 ounces.
1–3Q23 Results Snapshot
The company posted record revenues of $256.2 million in 3Q23 and a net income of $39.4 million, or $0.10 per diluted share. Revenues were up 19.9% from 3Q22 and down 1.8% sequentially.
AGI distributes a $0.025 quarterly dividend per share, or a yield of 0.76%, on an annualized basis.
AGI produced 135.4K Au ounces in 3Q23 and sold 132,633 Au ounces at $1,932 per ounce. In addition, the cost of sales was $158.0 million, down 6% YoY.
Another solid production—up 9.7% YoY and above quarterly projections—was the result of a notable boost in Mulatos District output.
AGI raised 2023 guidance to 515K–530K from 480K–520K Au ounces at an AISC between $1,125 and $1,175 per ounce.
Below are the 3Q23 highlights and increased 2023 guidance:
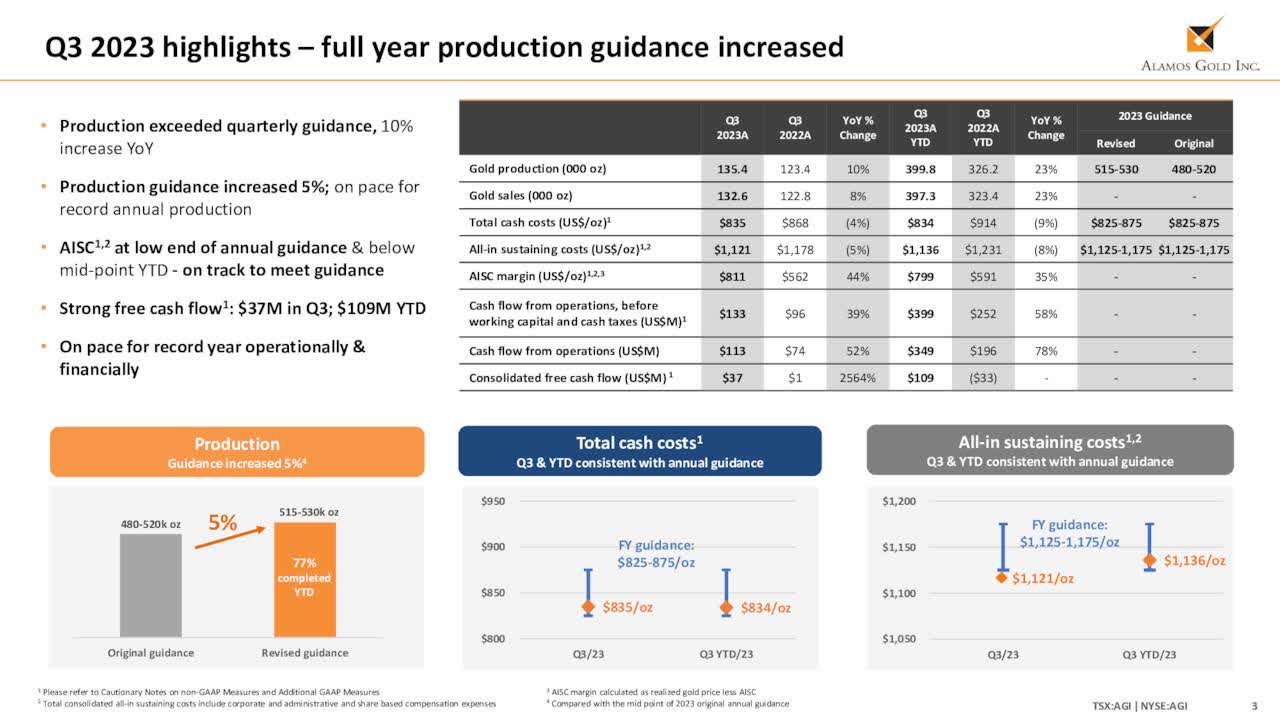
AGI 3Q23 Highlights and Guidance (AGI Presentation)
The YoY increase in production was explained by Young Davidson, Island Gold, and Mulatos district's continued strong performance. On the other hand, a sequential examination of gold production reveals a slight decline in overall AGI production. The Mulatos district's production fell 10.6% QoQ.
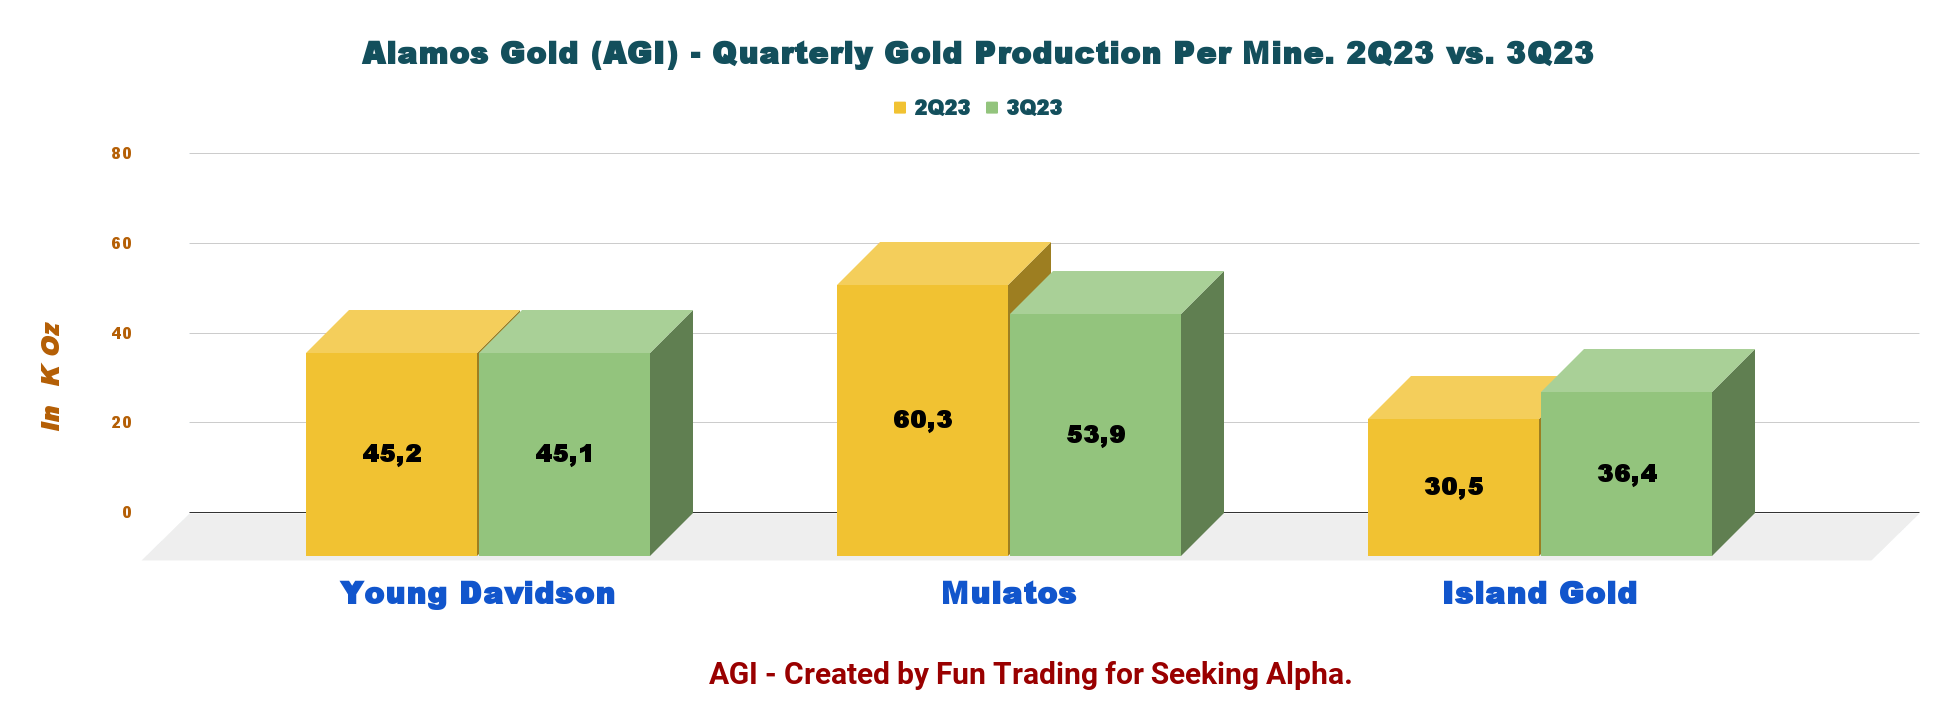
AGI Quarterly Production per Mine, 2Q23 versus 3Q23 (Fun Trading)
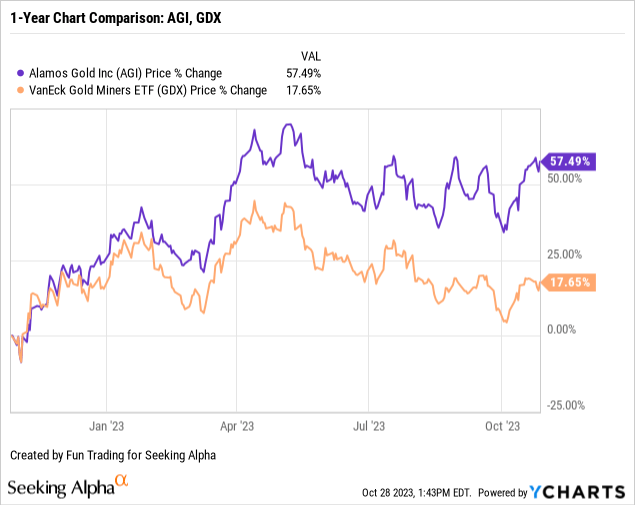
2: Stock Performance
AGI is currently up 54% year over year and outperforming the VanEck Vectors Gold Miners ETF (GDX).
 Data by YCharts
3: Investment Thesis
As I have said and repeated time and time again, Alamos Gold Inc. is a great company with excellent financials, no debt, and plenty of cash. It additionally pays a small quarterly dividend of $0.025.
Alamos is also supporting several projects (fully funded) that will eventually lead to a significant increase in revenue as early as 2024, such as the Island Gold Phase 3+ Expansion, which will increase ore milled to 2,400 TPD.
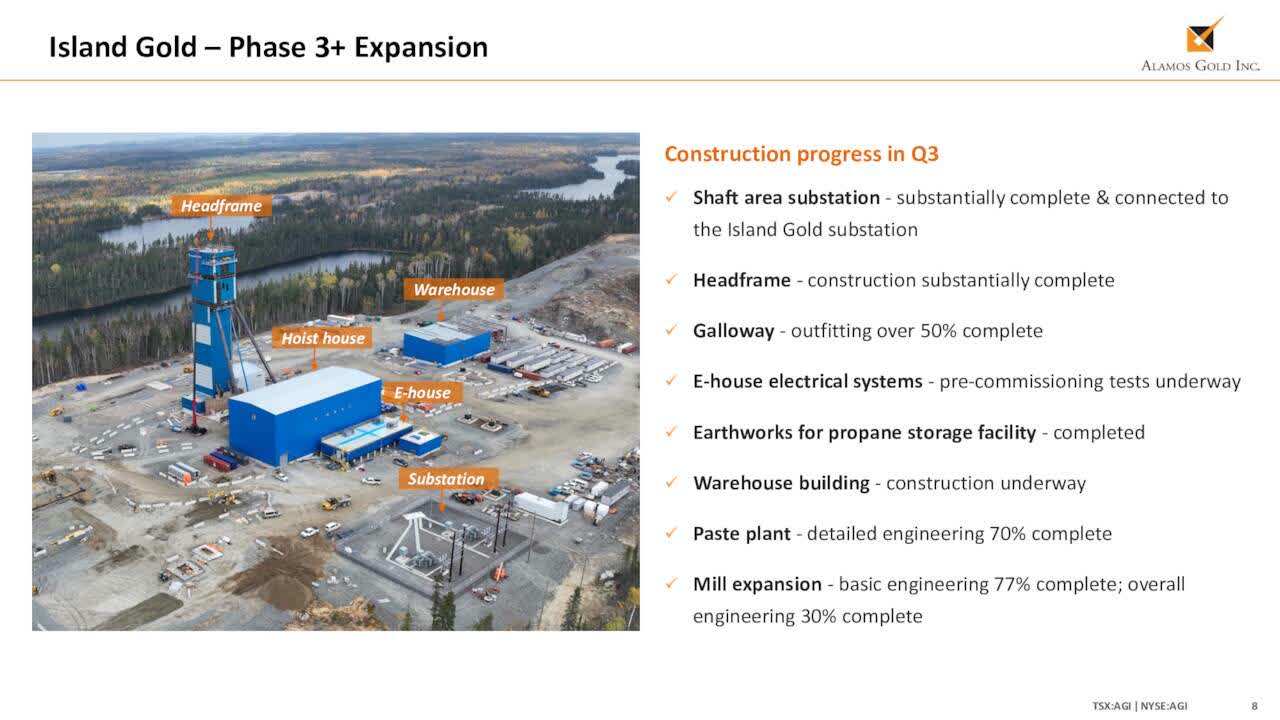
AGI Island Gold Expansion 3+ (AGI Presentation)
As planned, the construction will be completed in the first quarter of 2026; as of September 2023, 45% of the CapEx has already been spent.
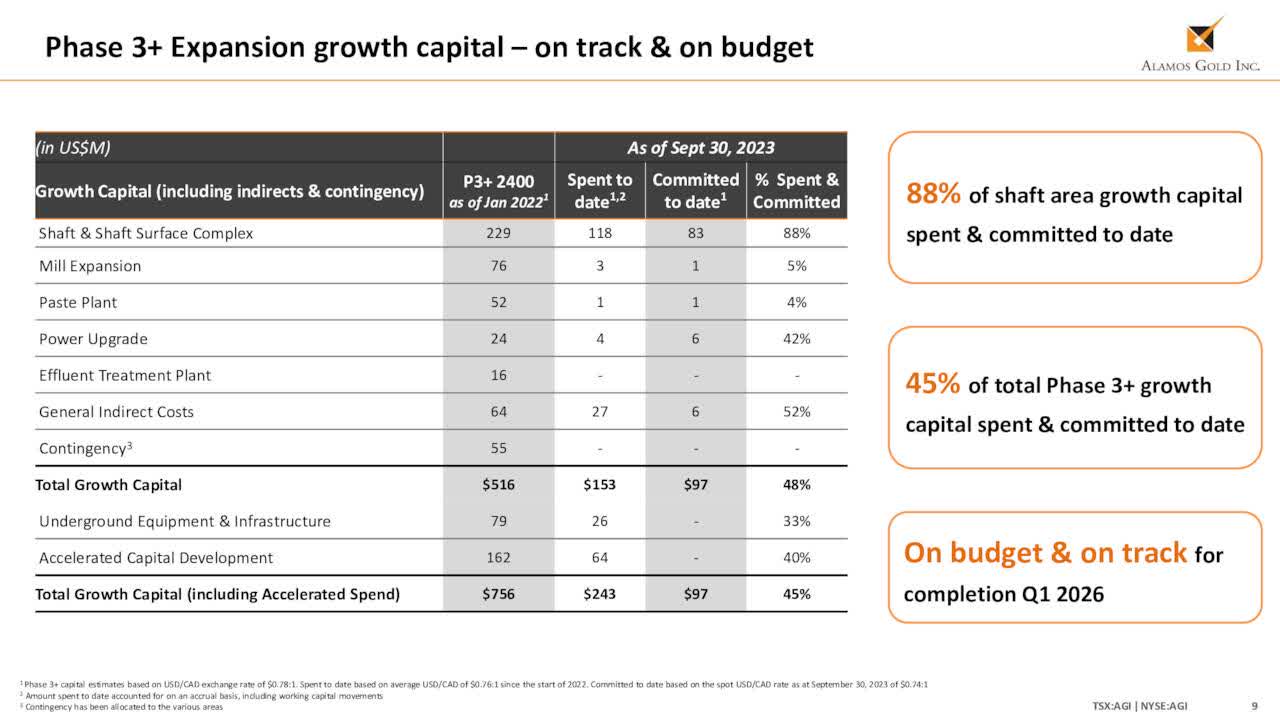
AGI Island Gold Expansion (AGI Presentation)
The price of gold, which varies greatly, is the only remaining uncertainty that has an impact on all gold miners.
Beyond Island Gold Expansion 3, as mentioned above, Alamos is also advancing the first phases of the Lynn Lake Project. In 2023, the company completed the new feasibility study.
This green project is exciting and will produce an average of 176K Au ounces per year for the first ten years.
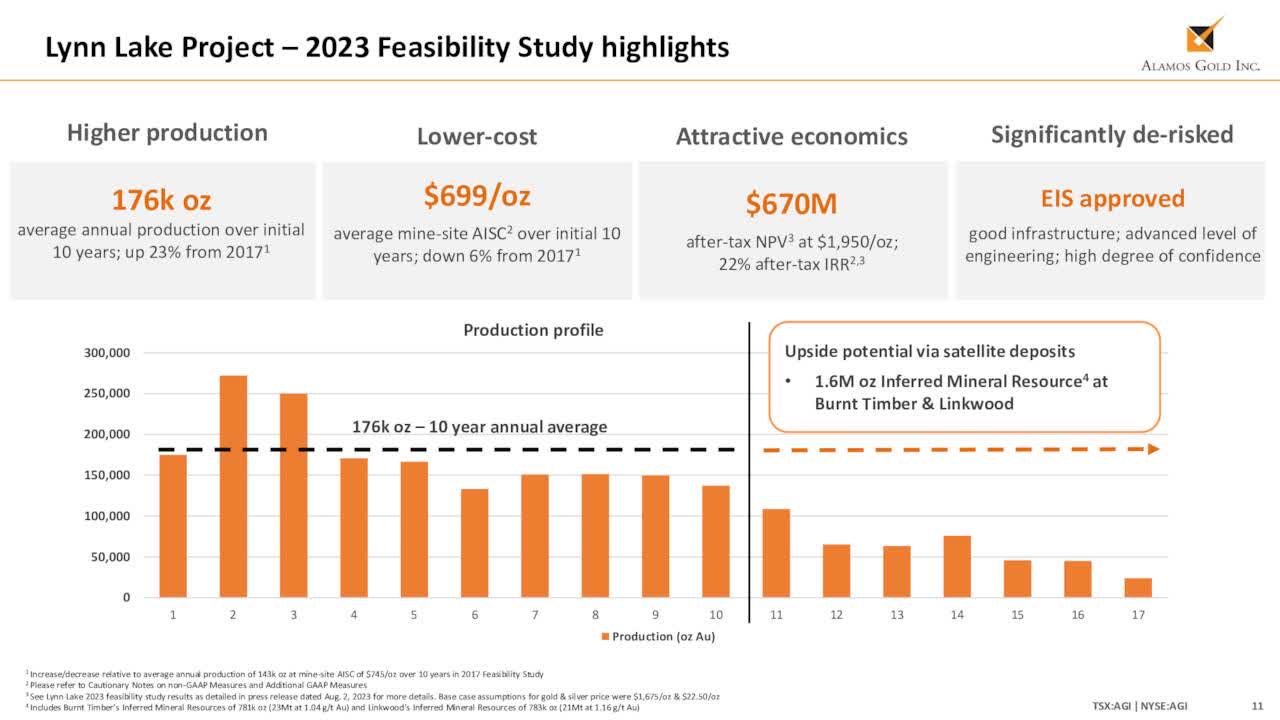
AGI Lynn Lake Project (AGI Presentation)
On the other hand, the price of gold has recently started to rise again and is currently trading above $2,000 an ounce, up 20% YoY.
Most notably, the Fed is becoming increasingly dovish and will likely announce a long pause beginning in early 2024, which is another positive for gold.
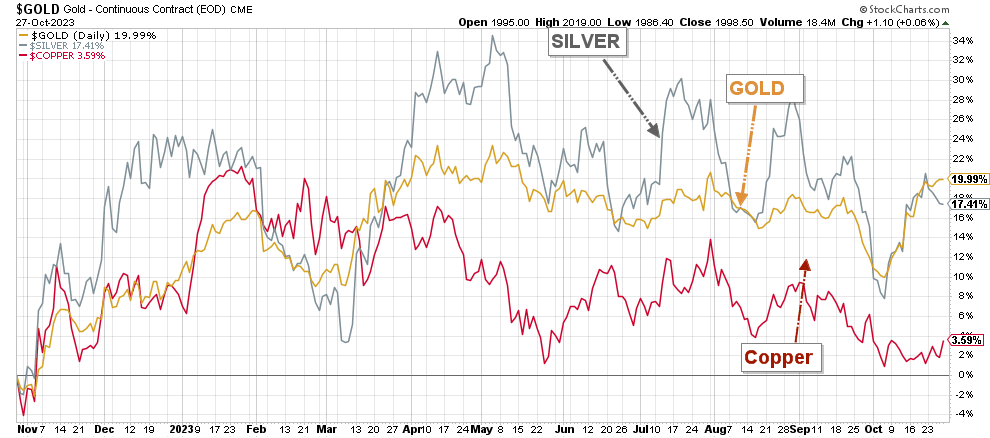
AGI 1-Year Chart Gold, Silver, Copper (Fun Trading StockCharts)
One negative is that we should never overlook the fact that AGI is a tiny gold producer with few production mines. The possibility of an unanticipated technical hiccup leading to a sudden stock correction is increased in this scenario. It is imperative that investors never overlook this inevitable element.
Therefore, it is important to trade AGI short-term LIFO with at least 40% of your entire position while maintaining a long-term core for a much higher target. The approach relies on both fundamental knowledge and technical analysis.
Alamos Gold: Financial Snapshot 3Q23: The Raw Numbers
| Alamos Gold | 3Q22 | 4Q22 | 1Q23 | 2Q23 | 3Q23 |
Total Revenues: $ million |
213.6 | 231.9 | 251.5 | 261.0 | 256.2 |
| Quarterly Earnings in dollars | -1.4 | 40.6 | 48.4 | 75.1 | 39.4 |
| EBITDA $ million | 84.8 | 100.4 | 119.9 | 138.9 | 126.0 |
| EPS (diluted) per share | 0.00 | 0.10 | 0.12 | 0.19 | 0.10 |
| Cash from Operating Activities:: $ million | 74.0 | 102.3 | 94.3 | 141.8 | 112.5 |
| CapEx in $ | 72.6 | 84.8 | 83.8 | 80.2 | 75.2 |
| Free Cash Flow | 1.4 | 17.5 | 10.5 | 61.6 | 37.3 |
| Total Cash:: $ million | 132.0 | 148.4 | 159.6 | 208.3 | 229.9 |
| Total LT Debt in Millions | 0 | 0 | 0 | 0 | 0 |
| Dividend:: $/share (semi-annual) | 0.025 | 0.025 | 0.025 | 0.025 | 0.025 |
| Shares Outstanding | 391.8 | 395.82 | 396.95 | 395.35 | 398.83 |
Source: Company press release.
Alamos Gold Financial Analysis
1: Revenues were $256.2 million in the third quarter of 2023
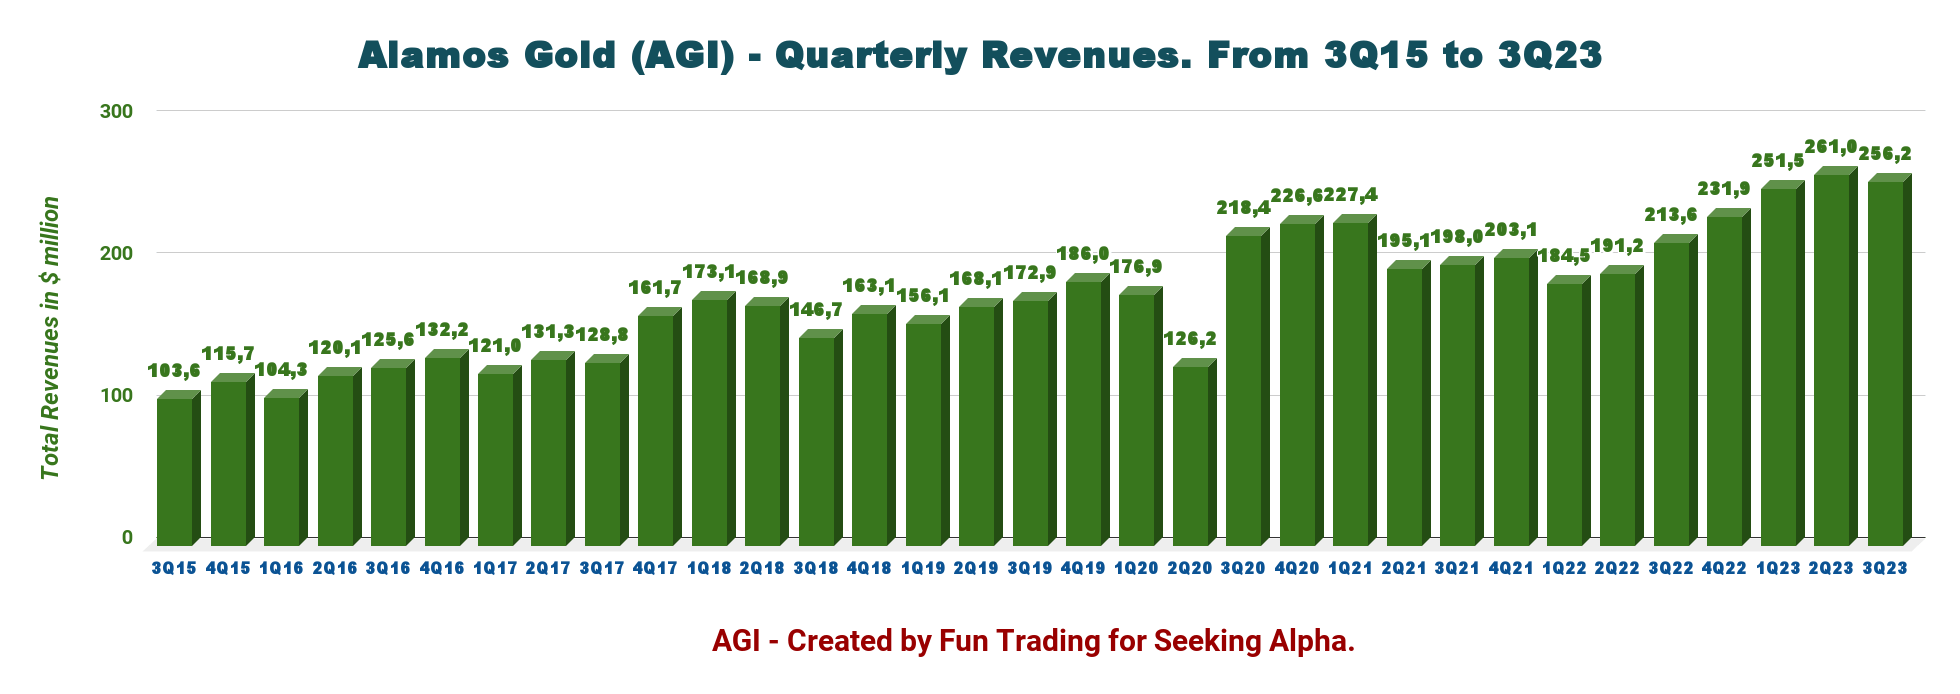
AGI Quarterly Revenue History (Fun Trading)
After reporting a loss of $1.4 million, or $0.00 per share, in 3Q22, the company reported a net income of $39.4 million, or $0.10 per share, in 3Q23.
Also, AGI's operations generated a cash flow of $112.5 million. $1,191/oz was the cost of sales for each ounce of gold sold.
Due to La Yaqui Grande, Island Gold's timing of sustaining, total cash costs of $835 per ounce were at the low end of annual guidance and AISC of $1,121 per ounce was below the low end of guidance.
2: Free cash flow was $37.3 million in 3Q23
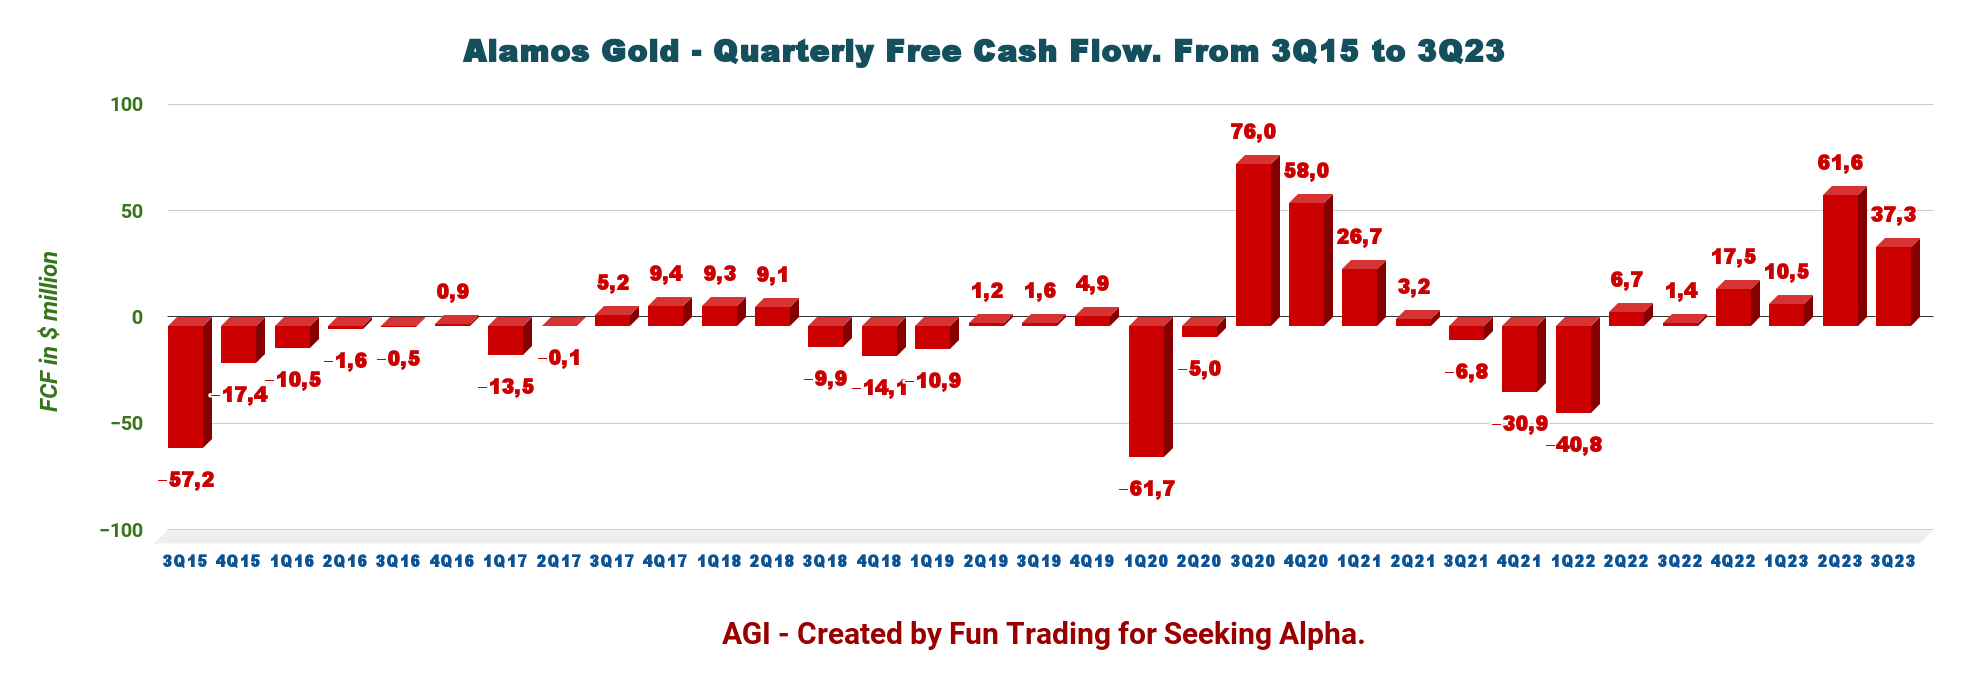
AGI Quarterly Free Cash Flow History (Fun Trading)
The company's trailing 12-month free cash flow (or "FCF") was $126.9 million, and in 3Q23, it reported $37.3 million in FCF.
3: The company is debt-free (net cash) and had total cash of $229.9 million in 3Q23.
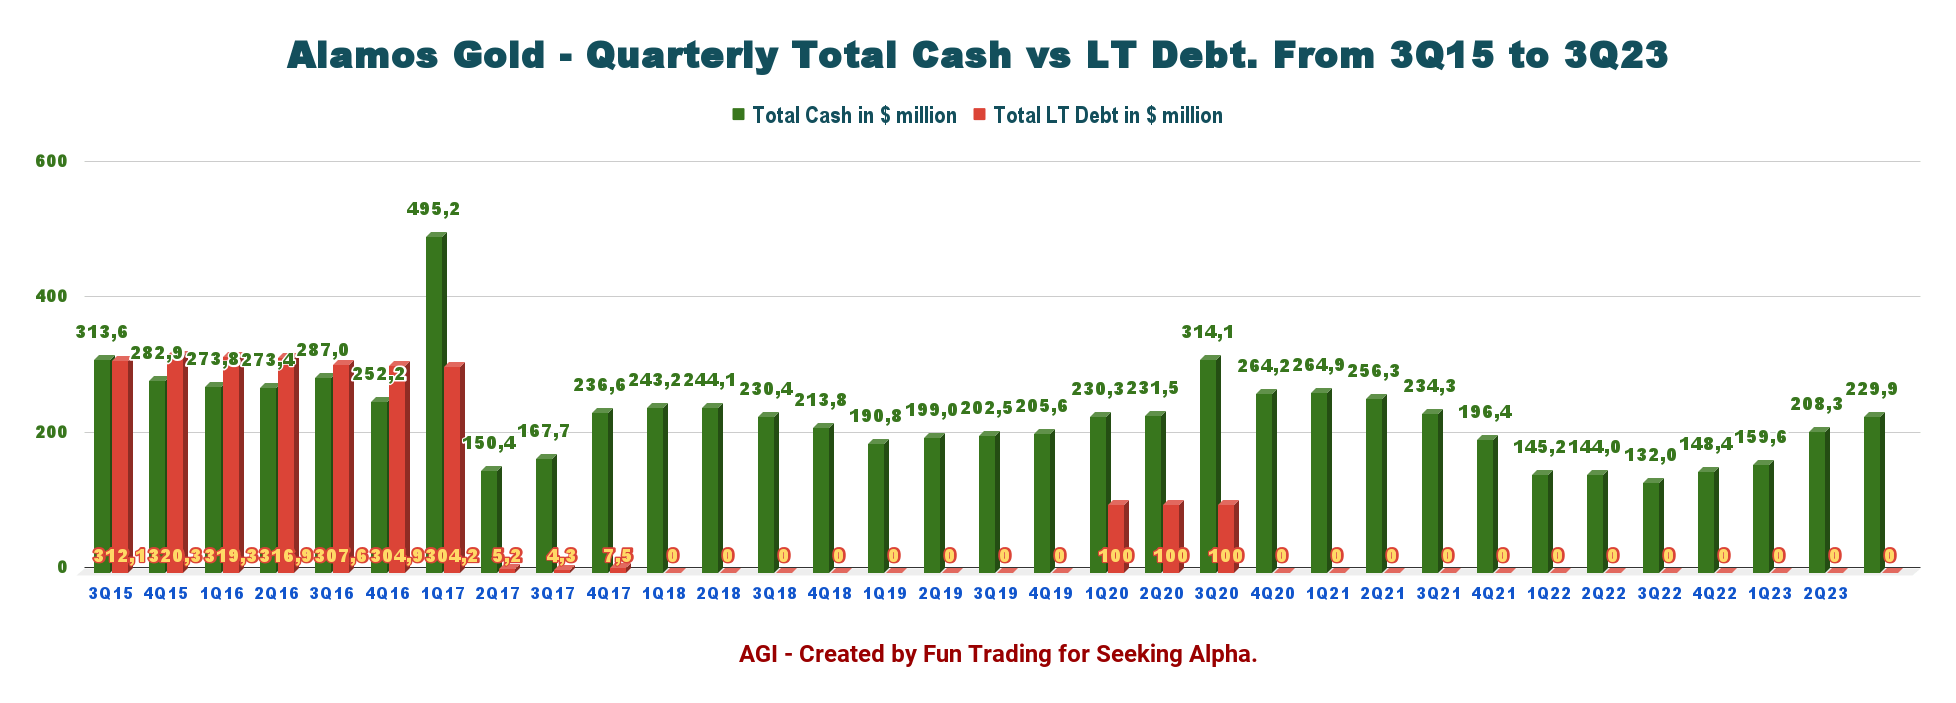
AGI Quarterly Debt versus Cash History (Fun Trading)
With record cash and cash equivalents/securities of $229.9 million at the end of the third quarter, Alamos Gold had also no debt and $730 million in liquidity.
4: Total quarterly production in 3Q23 was 135.4K Au ounces and sold 132,633 Au ounces
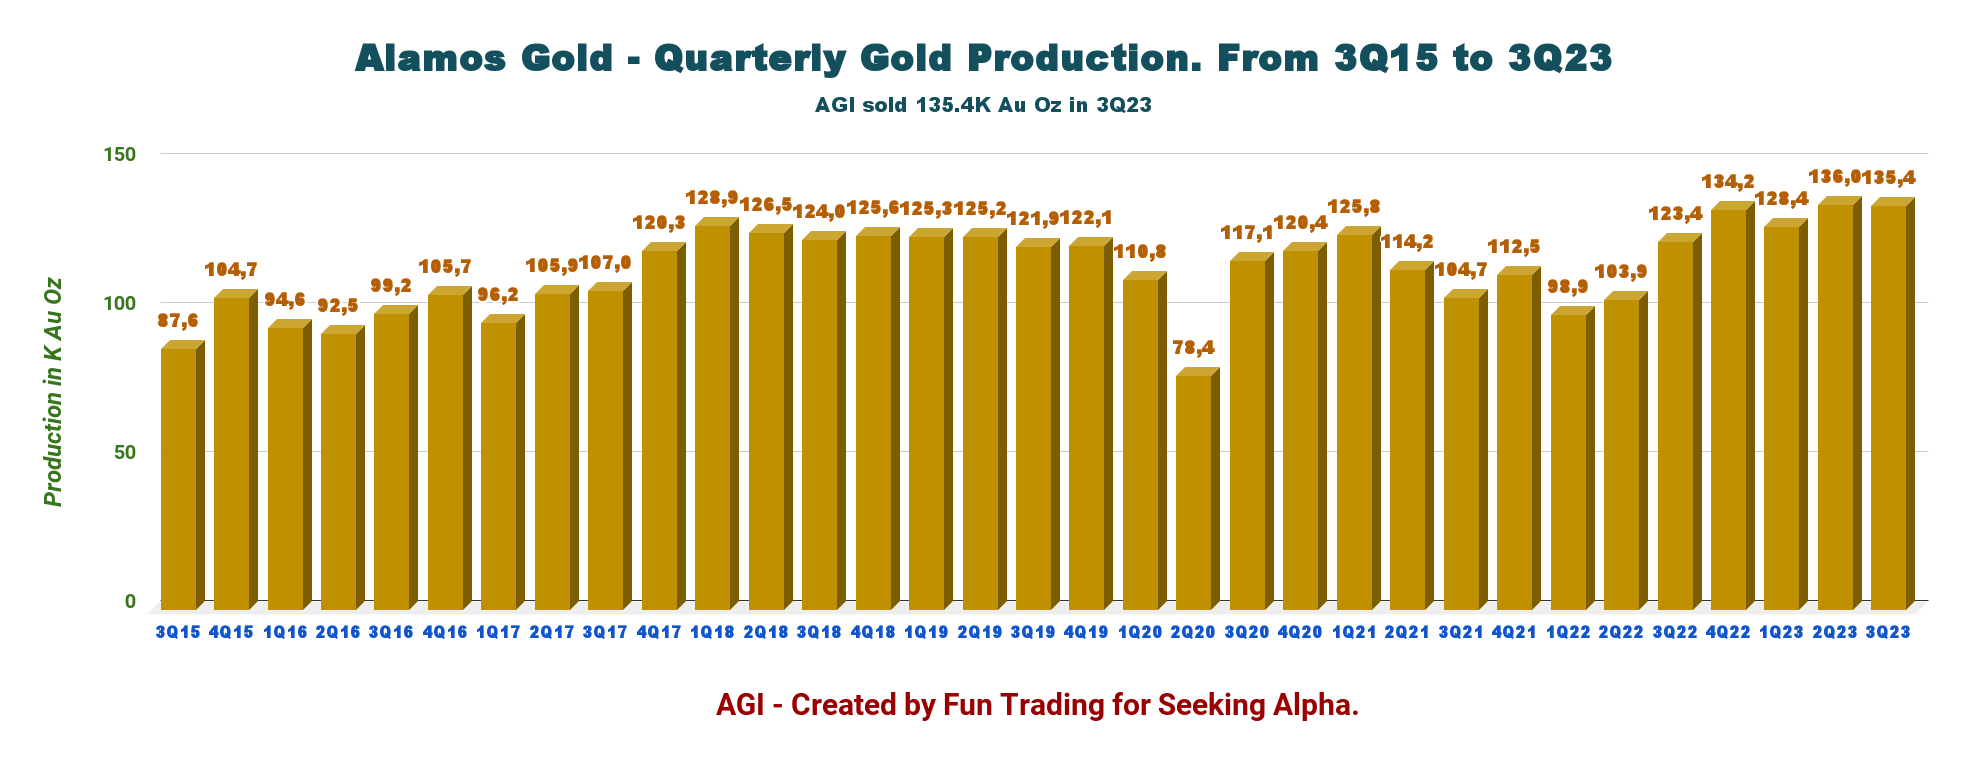
AGI Quarterly Gold Production History (Fun Trading)
In 3Q23, Alamos Gold sold 132,633 Au ounces of gold, with a reported production of 135,400 Au ounces.
Lower production QoQ at the Mulatos District was partially offset by strong production at the Island Gold and Young Davidson, resulting in a slight decrease from the second quarter of 2023.
- Below is the 3Q23 production per mine:
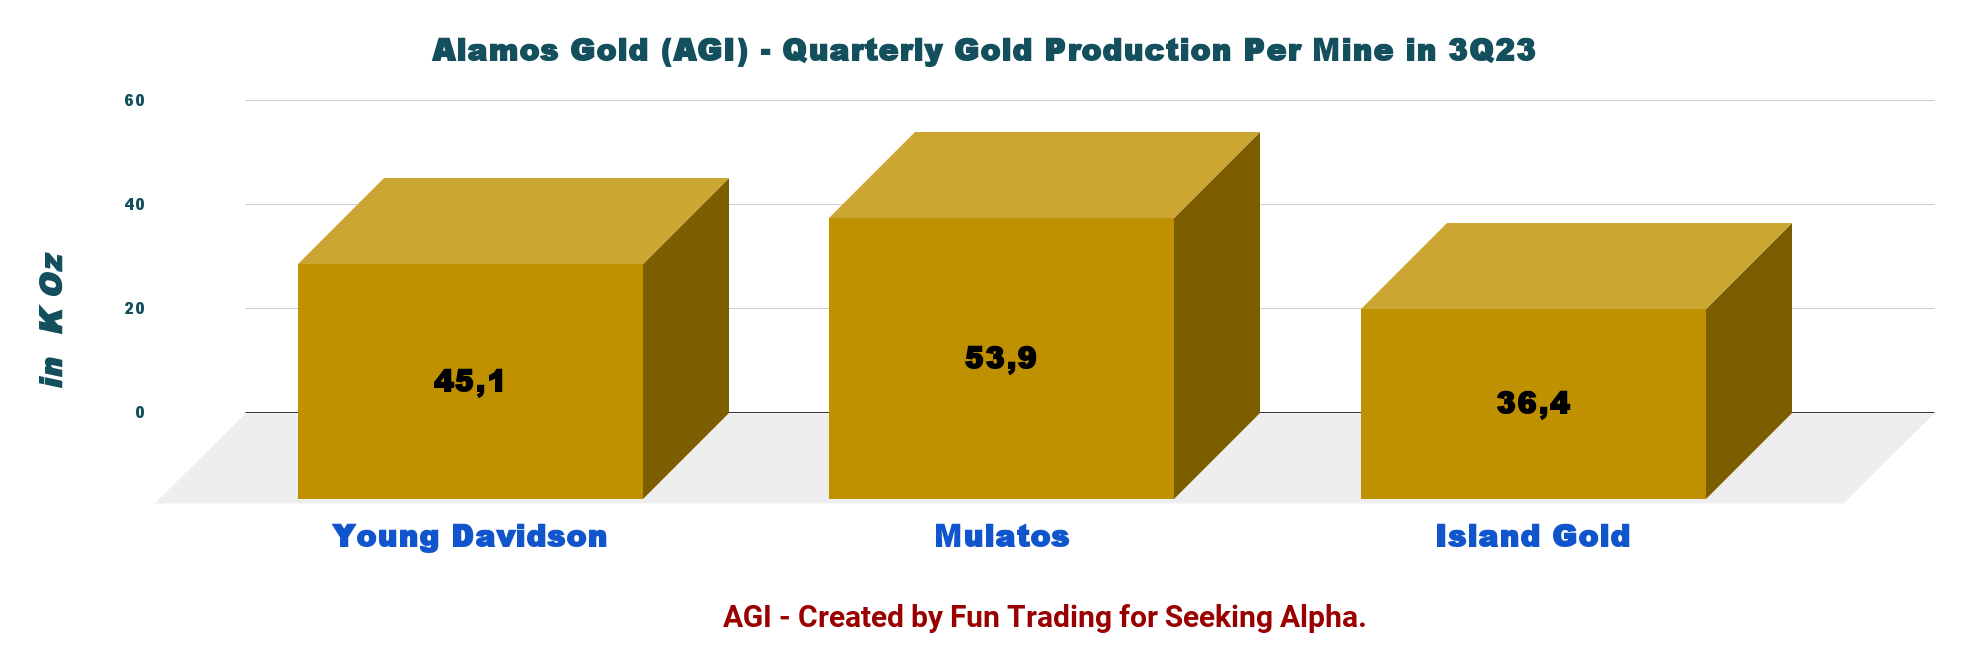
AGI 3Q23 Gold Production per Mine (Fun Trading)
The price of gold realized for the third quarter was $1,932 per ounce, down 2.3% sequentially.
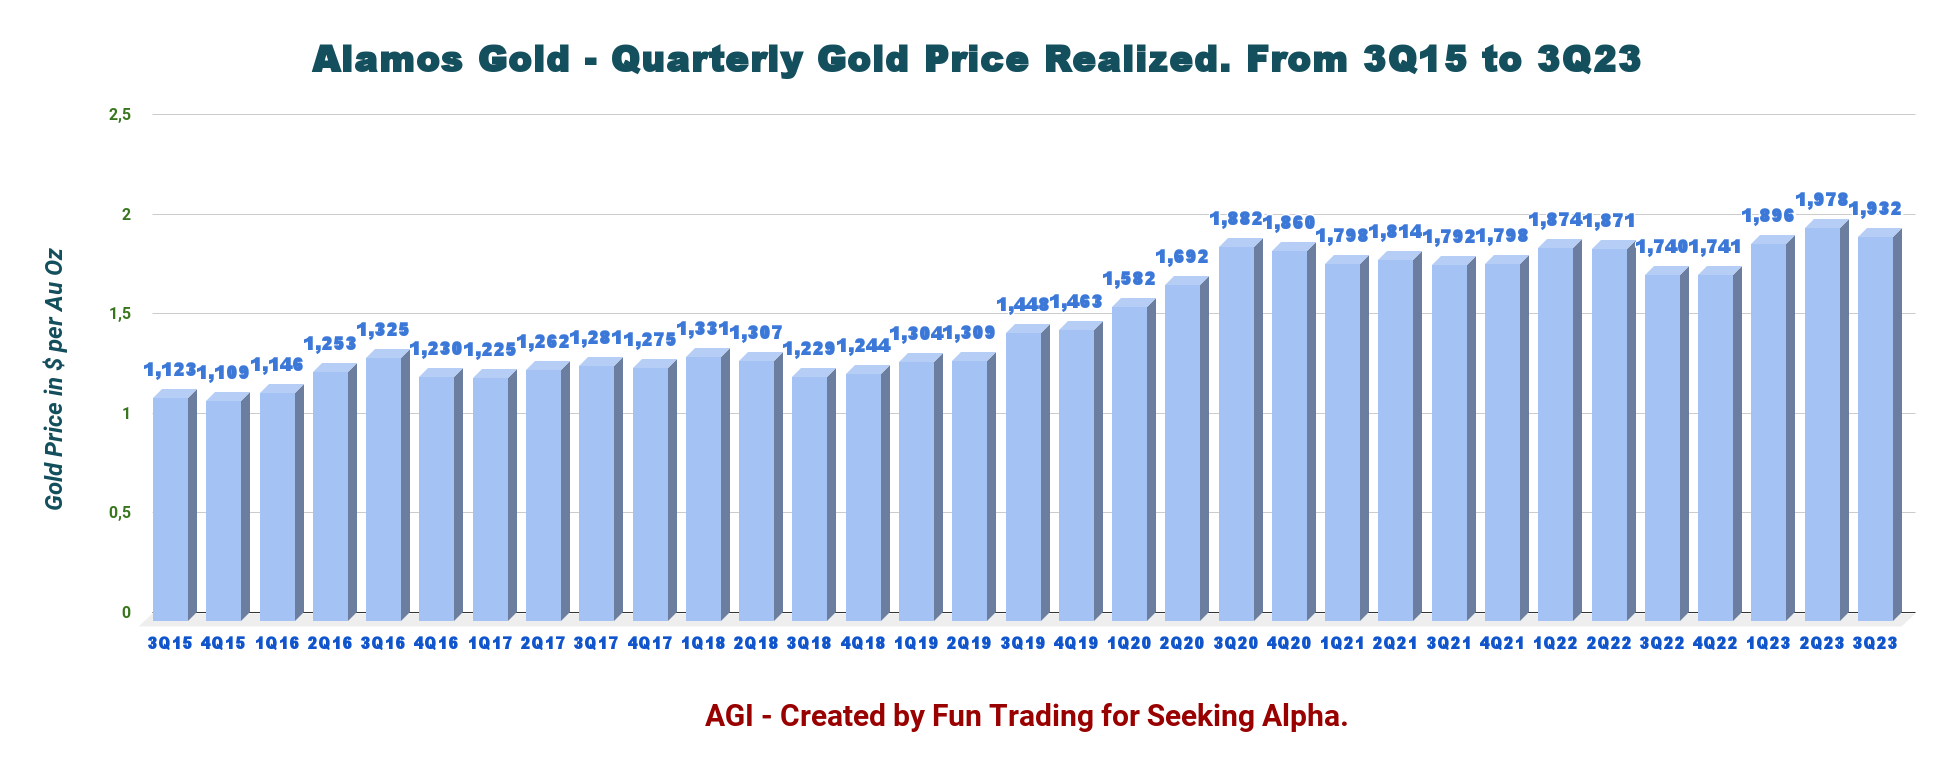
AGI Quarterly Gold Price History (Fun Trading)
At $1,121 per ounce this quarter, all-in-sustaining costs (AISC) are still low and have increased sequentially from $1,112 per ounce.
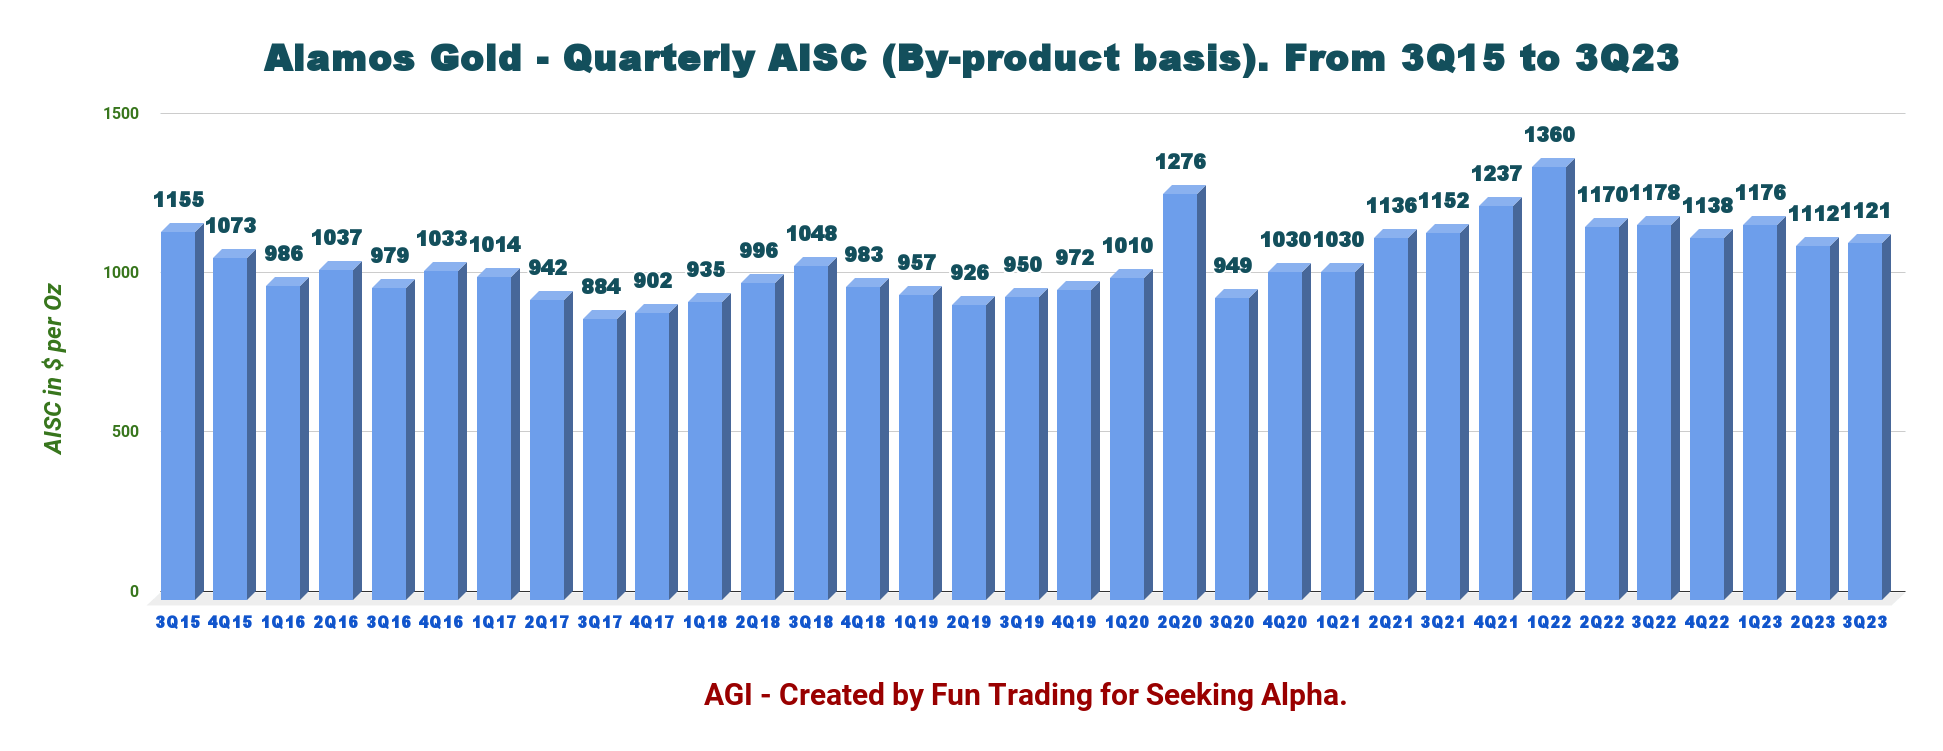
AGI Quarterly AISC History (Fun Trading)
5 - 2023 Guidance revised
AGI raised 2023 guidance to 515K–530K from 480K–520K Au ounces at an AISC between $1,125 and $1,175 per ounce.
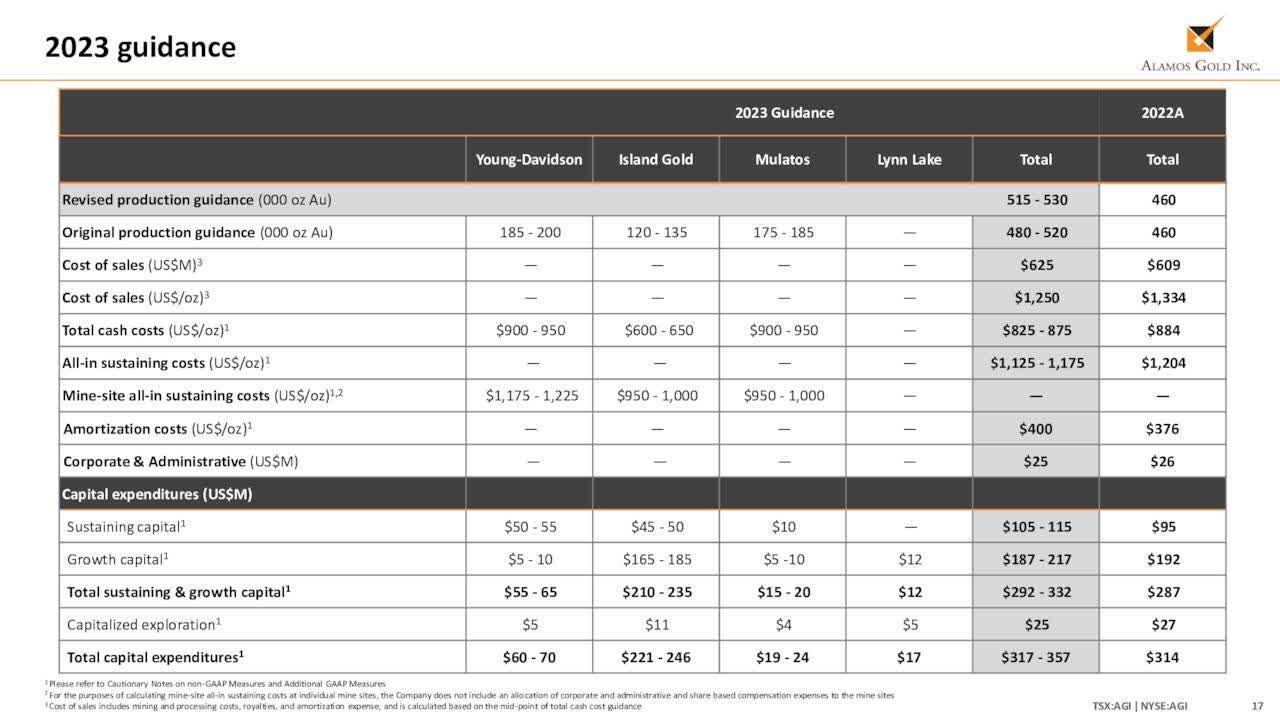
AGI 2023 Guidance Revised (AGI Presentation)
Technical Analysis (Short-Term) And Commentary
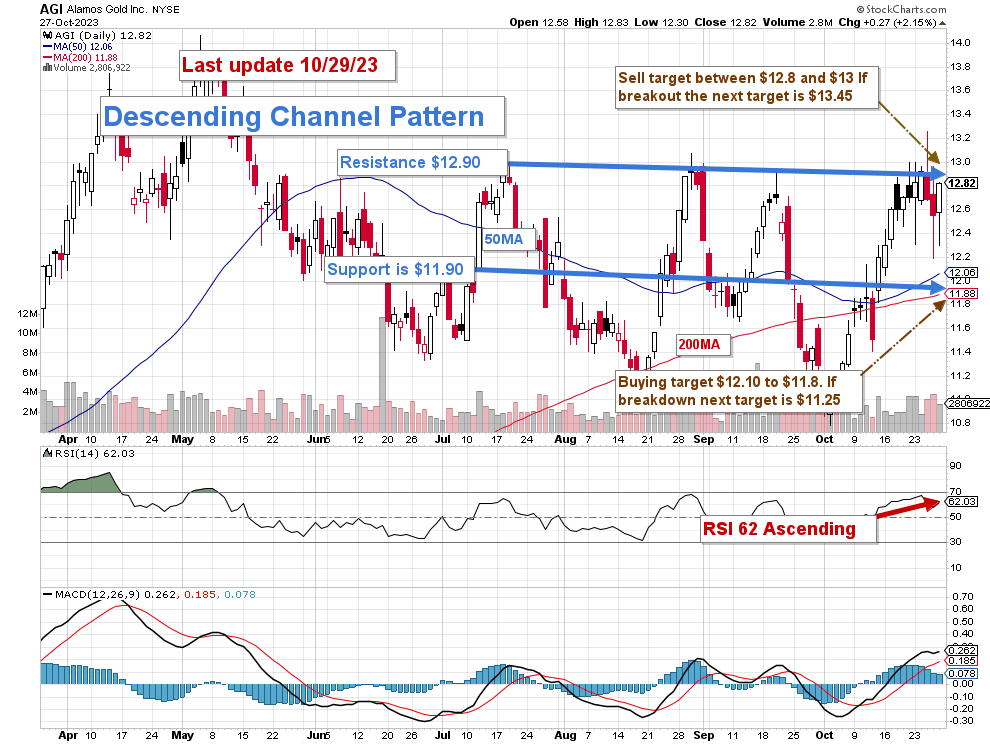
AGI TA Chart (Fun Trading StockCharts)
Note: The chart has been adjusted for the dividend.
The AGI chart shows an ascending channel pattern with resistance at $12.90 and support at $11.90. With the RSI at 62, it is getting close to the overbought level and flashing a sell signal soon.
The Descending Channel Pattern is a bearish chart formation used in technical analysis to identify potential downtrends in the market.
For AGI, the general approach I usually advocate is holding a core long-term position and using about 40% to trade LIFO while you wait for your core position to reach a higher final price target of $15–$16.
I suggest selling about 40% of your position between $12.8 and $13, with possible higher resistance at $13.45. Conversely, I recommend buying AGI between $12.10 and $11.80, with possible lower support at $11.25.
Watch the gold price like a hawk.
Warning: For the TA chart to remain current, it must be updated weekly. The above chart may be valid for up to one week. Keep in mind that the TA chart is merely a tool to assist you in choosing the best course of action. It is not a method for knowing the future. Nothing, and nobody can.
Disclaimer: Investing carries risk. This is not financial advice. The above content should not be regarded as an offer, recommendation, or solicitation on acquiring or disposing of any financial products, any associated discussions, comments, or posts by author or other users should not be considered as such either. It is solely for general information purpose only, which does not consider your own investment objectives, financial situations or needs. TTM assumes no responsibility or warranty for the accuracy and completeness of the information, investors should do their own research and may seek professional advice before investing.
