Sentiment Update: So You Think The Bear Market Is Over
Summary
- Last February, we suggested the nine-month decline in 2022 was the first wave of a two-section bear market, and another declining wave was coming after a large rally.
- We implied this second bear market should last about nine months - the same duration as the first. If it started in July, it would therefore end sometime mid May.
- We also suggested it would decline about the same percent - 25%. Adding to the decline since July 31st, this would suggest a further price decline of around 16%.
- Our two Master Sentiment Indicators show that, if this second wave of the bear market has begun, there is no sign yet that it is over.
CreativaImages
The Forecast
In an article last February Where is the Second Wave of the Bear Market we forecast a second wave of the bear market. We suggested the decline of 2022 was the first part of a two wave bear market. The ideas behind this were explained. We also said prices would probably reach 4800 on the S&P 500 before the second wave began. Although prices didn't reach 4,800, they did reach 4,580 on July 31st. Since then, prices have been declining starting what we think is the second wave down.
We suggested this second wave would last about the same time as the first – nine months. If July 31st is the start, that would mean the low of the second wave would occur around mid May.
We also suggested the second wave would decline about the same as the first - approximately 25%. Coupled with the price decline we’ve already experienced since July 31st, this suggests further price erosion of 16% on the S&P 500.
We discussed the economic foundation behind such a decline a month ago in this article: The Warren Buffet Bear Market.
Now, our two Master Sentiment Indicators show that, if we’re right about this second down wave, there is no sign from market sentiment that it's over.
Time and Price Targets
This chart is a graphic representation of what we expect from this second wave of the bear market. As we said, this wave down isn’t really a bear market in itself but the second wave down of a much longer bear market.
This longer bear market is in the form of two, large declining waves of 25% each, separated by a major rally back to the previous high. They're highlighted in the pink boxes below. A description of this is found in the text under the graph.

This is the graphic forecast of the two wave bear market we've been expecting. The two down waves are highlighted in pink. Each could be considered a bear market in itself because the decline is over 20% each. But they are really declining waves of a much longer ABC bear market. Point “A” is last year’s bear market low in October. Point “B” represents the top of the rally that separates the two bear markets. We believe it occurred in July. We're now embarked on the second wave which should end at Point “C.” A large corrective pattern like this is well known and is called a flat. It clearly demonstrates that the simple idea of bull and bear markets is just that, too simple, and that the real financial world is more complicated. It implies that the price correction of the huge COVID bull market will take place over a longer time period and will be in the form of two selling waves that look like independent bear markets but are really two large selling waves of a bigger corrective pattern. (The Sentiment King)
Sentiment Indicators Suggest The Bear Market's Not Over
The two charts below are our Master Sentiment Indicators – one measures sentiment over the long term, the other over the short to intermediate term. They're composites made by putting other sentiment indicators together into one in a mathematically consistent way. The first one, called the Master Sentiment Indicator, or MSI, is calculated weekly. The other (ST-MSI) is calculated on a daily basis.

The MSI (Master Sentiment Indicator) is composed of eight classic sentiment indicators fused together using our SK ranking system (the SK ranking system is explained at the end). These are the indicators that make up the MSI and we mathematically adjust each to reflect a long-term market view: 5% CBOE Total Puts and Calls Ratio, 5% CBOE Equity Puts to Calls Ratio, The CME Commitment of Traders data on the S&P futures, Buying in the ProShares S&P 500 Inverse Fund (SH), NAAIM Exposure Index (National Association of Active Managers), Hulbert Rating Service (Stocks), Hulbert Rating Service (Nasdaq), The AAII Sentiment Survey,. The red-green chart below shows the multiple extreme readings of the MSI this year and over the last 15 years. The correlation with major market lows is phenomenal and we believe it better than any economic or financial metric in this regard. (The Sentiment King)
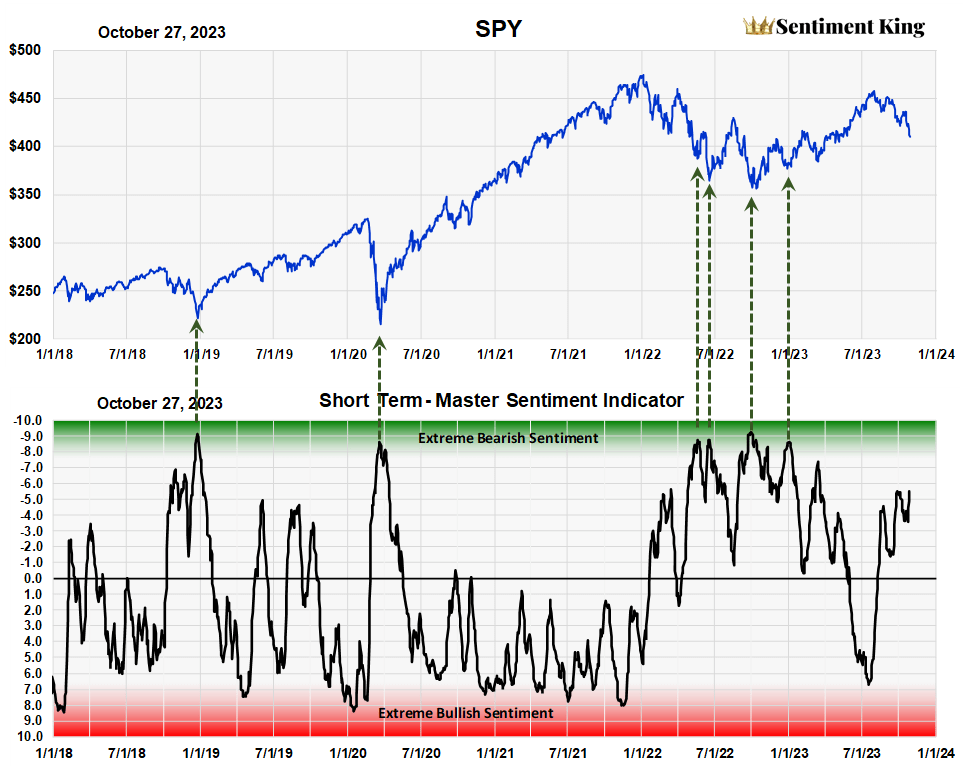
The ST-MSI (Short Term Master Sentiment Indicator) is composed of seven sentiment indicators that are calculated daily. We adjust the data of each to reflect a shorter-term view of the market. They’re combined into one indicator using our SK ranking system. The components that make up the ST-MSI are: Hulbert Rating Service (Stocks), Hulbert Rating Service (Nasdaq), VIX, 20% Equity P/C, 20% Total P/C, ProShare Bull/Bear Purchase Ratio, ProShare UltraPro Bull/Bear Purchase Ratio,. The chart of the ST-MSI also shows the extreme readings reached this year and over the last seven years. Being a short-term sentiment indicator, it measures quick changes in investor outlook for the market. (The Sentiment King)
Bear markets have never ended without investor sentiment becoming extremely bearish at the bottom. At bear market lows people become so negative they can't see anything but further price declines. We call these Green Zone readings. We've indicated past green zone readings on the charts with arrows.
You can clearly see the extreme readings that accompanied last year's bear market low. We heralded the bullish meaning of these green zone readings all last year, yet only a few readers paid attention.
When applying sentiment to help find market highs and lows, you follow the price trend either up or down until sentiment has gone to an extreme. Since we don't have that yet, we assume that the downtrend in prices will continue until these indicators reach green zone readings.
You can see that the current rating on both these indicators is not yet in the Green Zone. We will hold with the bearish forecast until we get green zone readings.
Disclaimer: Investing carries risk. This is not financial advice. The above content should not be regarded as an offer, recommendation, or solicitation on acquiring or disposing of any financial products, any associated discussions, comments, or posts by author or other users should not be considered as such either. It is solely for general information purpose only, which does not consider your own investment objectives, financial situations or needs. TTM assumes no responsibility or warranty for the accuracy and completeness of the information, investors should do their own research and may seek professional advice before investing.
