USDX: sharp drop last week.
2023/11/18:
USDX experienced a sharp drop last week.
The chart below is showing:
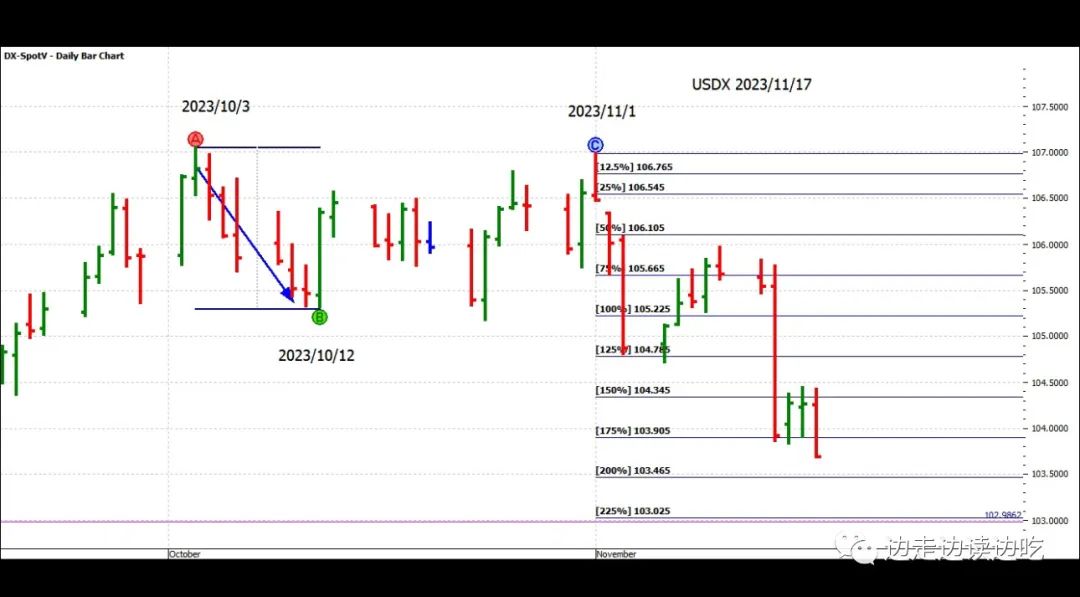
→ The 2nd decline was from 01/11/2023.
→When it dropped to 125% resistsnce, it gained support and rebounded for 5 days.
→ However,USDX resumed its downward trend last Monday by trading below previous day's low.
→Sharp declined on last Tuesday from 75% resistance to 175% resistance.
→Rebounded from 175% to 150% on Wednesday and Thursday.
→Broke below 175% support level on Friday.
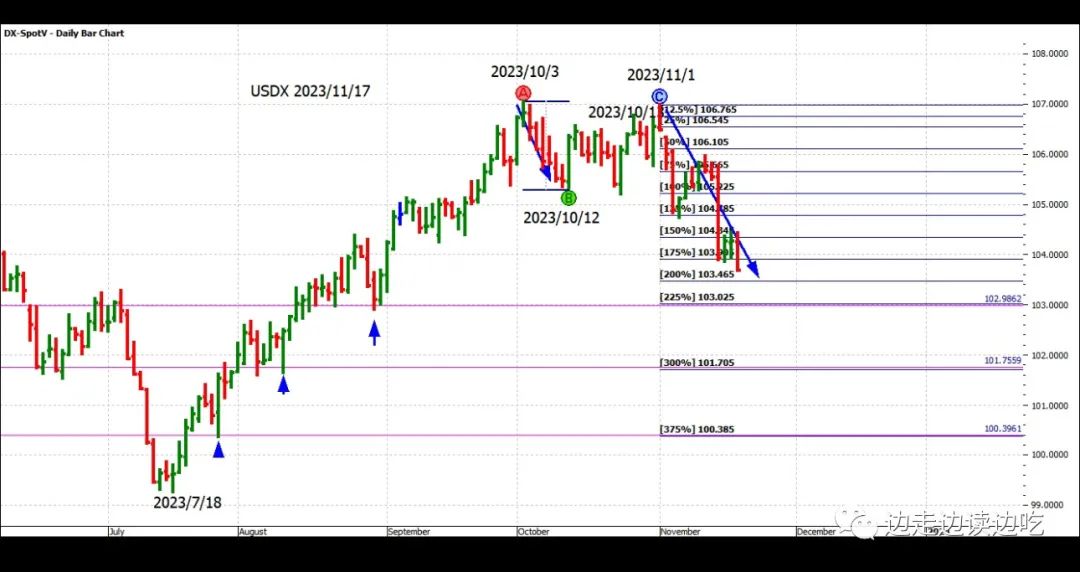
Future support levels: ( pink lines)
→225% $103.025
→300% $101.705
→375% $100.383
All in alignment with the previous bottoms ( blue arrows)

Disclaimer: Investing carries risk. This is not financial advice. The above content should not be regarded as an offer, recommendation, or solicitation on acquiring or disposing of any financial products, any associated discussions, comments, or posts by author or other users should not be considered as such either. It is solely for general information purpose only, which does not consider your own investment objectives, financial situations or needs. TTM assumes no responsibility or warranty for the accuracy and completeness of the information, investors should do their own research and may seek professional advice before investing.
