Fortuna Silver Mines: Seguela Full Production Boosted Quarter Results
Summary
- Fortuna Silver Mines announces third-quarter 2023 financial results with record production and financial figures.
- The Séguéla Mine in Ivory Coast starts producing, contributing to increased gold sales and improved net income.
- Positive outlook for gold and silver prices, making it a good time to accumulate Fortuna Silver Mines stock.
plastic_buddha
Introduction
On November 8, 2023, Fortuna Silver Mines (NYSE:FSM) announced its third-quarter 2023 financial results. This article is an update to the one I wrote on October 8, 2023. I have been a follower of FSM on Seeking Alpha since December 2021.
This quarter marked the start of the Séguéla Mine's first complete reporting period, with 31,498 Au Oz produced in 3Q23 at an AISC of $783/oz.
As the Séguéla mine is now operating at maximum capacity, this quarter is a critical turning point in the production of gold for the company. The company's output rose roughly 26% beginning in 3Q23 and will continue to do so for the foreseeable future.
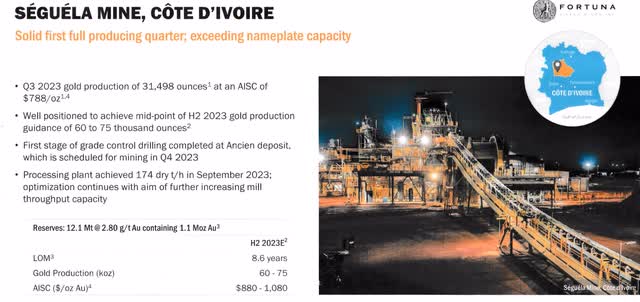
FSM Seguela Mine (FSM Presentation)
The stock has not performed very well, even if the recent results push FSM higher. After a substantial retreat since April 2023, Fortuna Silver Mines Inc. is currently down 5% year over year.
The recent decline in gold and silver prices appears to have had a particularly negative impact on gold and silver miners during the previous several weeks. However, I am confident that this situation will reverse in 2024.
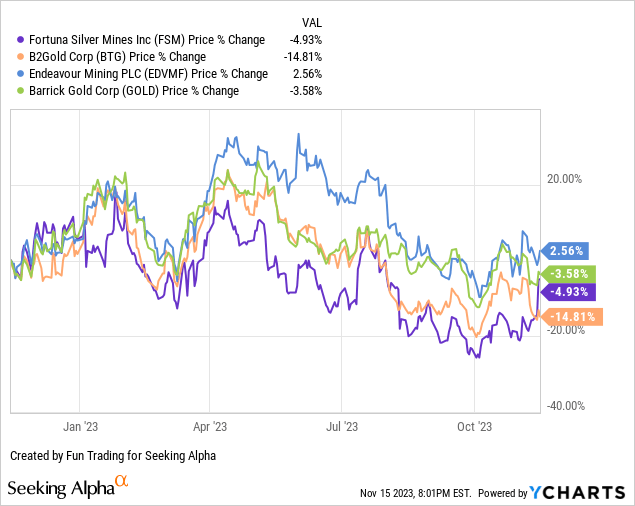 Data by YCharts
I concur with CoinpriceForecast, which projects that gold will surpass $2,000 by the end of 2023 and reach $2,200 in the second half of 2024. It is a little more bullish than I am right now, but the miners will have a very prosperous year in H2 2024 even if gold continues at $2,100 an ounce.
Gold price started in 2023 at $1,830.10. Today, Gold traded at $1,968.60, so the price increased by 8% from the beginning of the year. The forecasted Gold price at the end of 2023 is $2,059 - and the year to year change +13%. The rise from today to year-end: +5%. In the first half of 2024, the Gold price will climb to $2,202; in the second half, the price would add $25 and close the year at $2,227, which is +13% to the current price.
In summary, I think that a substantial rise in gold equivalent production from the Seguéla mine will greatly improve FSM's balance sheet in 2024, making it a good time to purchase the company's stock now. Furthermore, I believe the FED will declare an end to rate increases and possibly start a reduction in interest rates in the second half of 2024, so I predict that gold and silver miners will be strong performers in 2024.
Let's look at the Third-Quarter 2023 in details
1: Revenue and other financial data
In the third quarter of 2023, Fortuna Silver Mines generated record revenues of $243.06 million and net income of $27.47 million, or $0.09 per diluted share. The same quarter last year saw a net loss of $3.75 million, or $0.01 per diluted share.
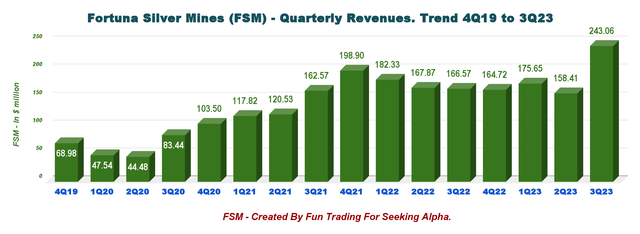
FSM Quarterly Revenue History (Fun Trading)
Adjusted attributable net income for the quarter was $29.6 million after deducting non-cash and non-recurring components, as opposed to $2.9 million in 3Q22.
The primary factors contributing to the rise in net income and adjusted net income are the increased volume of gold sales, the more favorable realized prices of gold and silver, and the decreased cost of sales per ounce of gold equivalent. Increasing grades at Yaramoko and the first quarter of commercial production at Séguéla were the main contributors to the growing volume of gold sold.
CEO Jorge Alberto Ganoza said in the conference call:
let me tell you why the achievements of this quarter are so important. I see this as an inaugural quarter due to the start of contribution of our feed and flagship mine Séguéla. So I will be comparing performance versus the previous second quarter, which I believe helps better see the impact and the change in the business. Production and financial results are highlighted by record figures across all relevant metrics of the business.
The Free cash flow turned positive this quarter
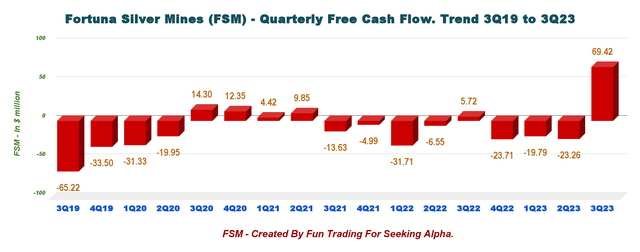
FSM Quarterly Free Cash Flow History (Fun Trading)
My calculation differs from that of the company, which uses another measure and has indicated a FCF of $70.0 million. The free cash flow calculation is a non-IFRS financial metric that varies throughout the gold sector. Thus, you need to use the same calculation in order to compare correctly. It is what I have done. Based on the cash flow from operations, less CapExThe FSM's trailing 12-month free cash flow was $2.66 million, with $69.42 million in 3Q23. I anticipate consistent positive free cash flow into 2023 and 2024, which may help the company declare a dividend in 2024.
Finally, Fortuna's net debt was $133.4 million, and its liquidity was $162.3 million. Some good progress QoQ with higher cash and reduced debt.
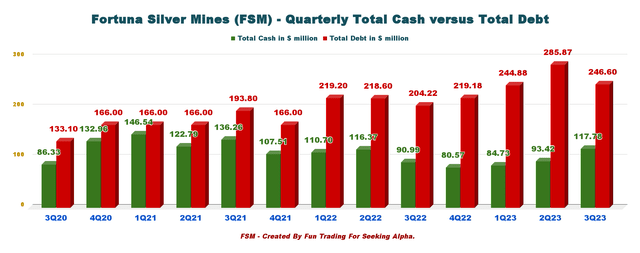
FSM Quarterly Cash versus Debt History (Fun Trading)
The company had $117.78 million in cash equivalents and $246.6 million in total debt as of September 30, 2023. The company has $162.3 million in net liquidity.
Fortuna paid its $40.0 million revolving credit facility. There was $133.4 million in total net debt at the end of the quarter, and the ratio of total net debt to adjusted EBITDA improved to 0.5x.
2: Gold and Silver Production in 3Q23
Fortuna Silver Mines produced 94,821 ounces of gold and 1,680,751 ounces of silver for the third quarter. That translated to 128,671 GEOs, a 37.7% YoY increase. The AISC was lower this quarter with $1.312 per GEO.
The lower AISC resulted from a $67 decrease in the cash cost of sales per gold equivalent ounce to $814 and lower capital expenditures per ounce as a result of greater output.
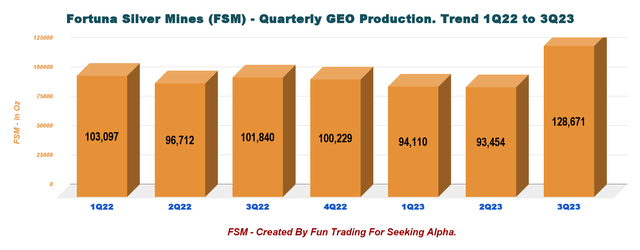
FSM Quarterly GEO Production History (Fun Trading)
Gold, silver, lead, and zinc production are included in GEOs, which are calculated using the following metal prices: $23.70/oz Ag, $1,924/oz Au. Also, one pound of lead was sold at $0.97 and one pound of zinc was sold at $1.10.
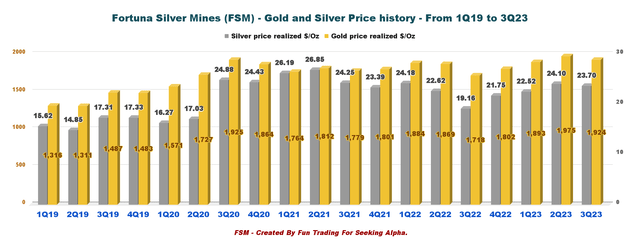
FSM Quarterly Gold and Silver Price History (Fun Trading)
The quarterly production of gold and silver is shown below.
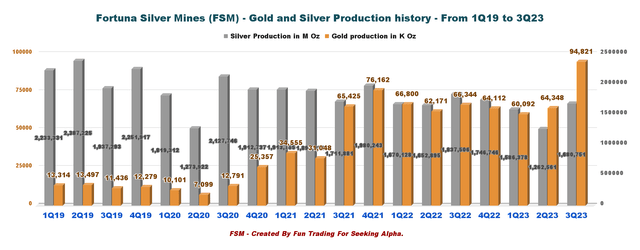
FSM Quarterly Gold and Silver Production History (Fun Trading)
Finally, the company produces lead and zinc exclusively from the company's Caylloma mine in Peru. Lead production in 3Q23 was 10,337 metric tons, while zinc production was 14,037 metric tons.
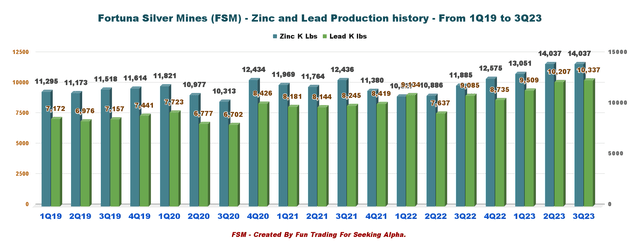
FSM Quarterly Zinc and Lead Production History (Fun Trading)
Comparing the same period in 2022 to the current, lead and zinc production increased by 14% and 18%, respectively. Positive grade reconciliation to the reserve model at levels 16 and 18 of the Animas vein led to increased production. The higher grades also enabled increased zinc and lead recoveries.
3: 2023 Guidance was re-affirmed this quarter
The annual production guidance range for Fortuna Silver Mines in 2023 was reaffirmed as follows: 6.3 to 6.9 moz of silver and 282K to 320K ounces of gold, or 412K to 463K gold equivalent ounces, including lead and zinc by-products.
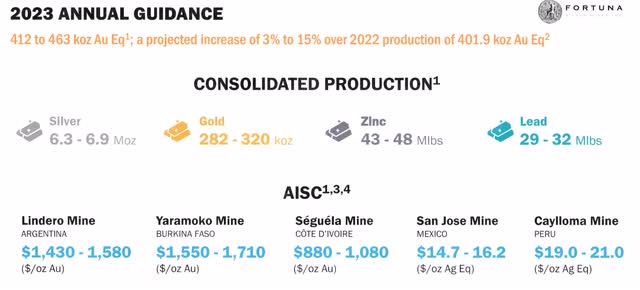
FSM 2023 Guidance (FSM Presentation)
4: Technical Analysis (Short Term) and Commentary
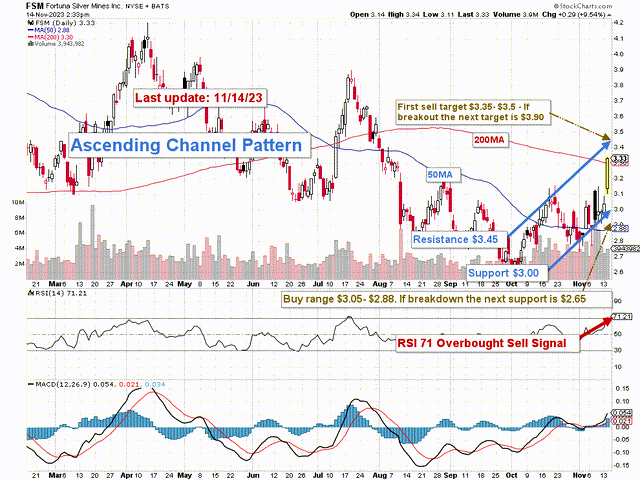
FSM TA Chart (Fun Trading StockCharts)
FSM forms an ascending channel pattern, with $3.45 acting as resistance and $3.00 as support. The current RSI of 71 shows that FSM is overbought and flashes a sell signal.
Although the ascending channel pattern is usually bullish, it generally ends in a breakdown, so we will have to be careful here. As a result, it's crucial to take a profit immediately and anticipate a possible retracement.
I advise holding a core long-term stake and trading short-term LIFO with roughly 40% of your FSM position. It lets you hold off on your long-term position until 2024, when a greater ultimate price objective of between $5 and $6 may be reached.
In the medium run, I would sell a portion of the Fortuna Silver Mines Inc. shares between $3.35 and $3.50, with an upper resistance level of $3.90, and hold onto it, hoping for a pullback between $3.05 and $2.8, with $2.65 possibly acting as lower support.
Warning: The TA chart must be updated frequently to be relevant. The chart above has a possible validity of about a week. Remember, the TA chart is a tool only to help you adopt the right strategy. It is not a way to foresee the future. No one and nothing can.
Disclaimer: Investing carries risk. This is not financial advice. The above content should not be regarded as an offer, recommendation, or solicitation on acquiring or disposing of any financial products, any associated discussions, comments, or posts by author or other users should not be considered as such either. It is solely for general information purpose only, which does not consider your own investment objectives, financial situations or needs. TTM assumes no responsibility or warranty for the accuracy and completeness of the information, investors should do their own research and may seek professional advice before investing.

