SH: Don't Short The S&P 500, At Least Not Yet
Summary
- The S&P 500 is expected to consolidate at 4,800 before breaking out and making new highs.
- Buying activity in SH is still too high and suggests caution on shorting the S&P 500 at current levels.
- Assets under management in SH are contracting but are still high enough to suggest the stock market has higher to go.

chachamal/iStock via Getty Images
We believe the S&P 500 will temporarily consolidate at 4,800 before breaking into new highs. We detailed the reasons for this bullish forecast in an article a week ago, S&P 500: Double Top or Breakout To New Highs? If this forecast is correct, now is not the time to buy or hold ProShares Short S&P500 ETF (SH) to position for a major decline in the S&P 500.
It’s also not the time to buy SH expecting a short-term decline. While a short-term decline might occur once the S&P 500 reaches 4,800, the probability of making money on it is too low. The inherent timing problems, emotional pressures, and small investment return it would produce simply aren’t worth the risks.
Using SH As A Market Indicator
Since SH is an ETF that is short the S&P 500, monitoring investor activity in the fund is a wonderful window into the minds of investors. It’s a great tool to measure what investors expect the market to do. Because of this, we use investor activity in SH itself to help decide if one should buy SH. We did this when we warned investors away from SH in an October 28th article, It's Too Soon to Sell This Market.
Investor activity in SH still points to caution on going short the S&P 500 - at least for now.
Investor Buying Of SH Has Come Down But It’s Still Not Low Enough
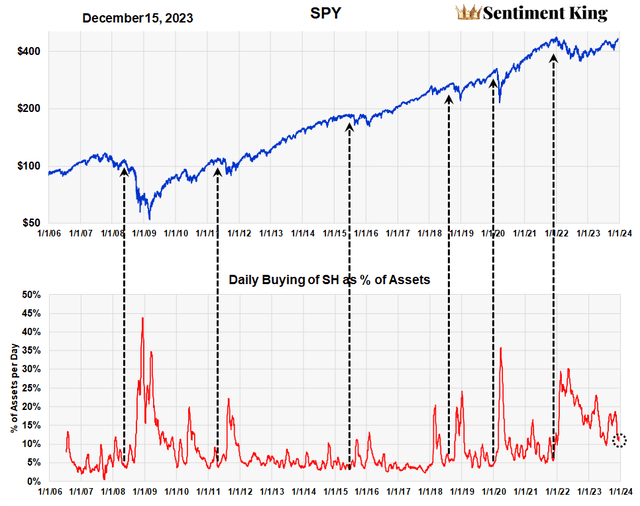
This chart shows the daily amount of buying in SH as a percentage of assets. It goes back to 2006. It shows that high levels of buying in SH occur at bear market lows and low levels occur right before prices start into bear markets. This is the opposite of what you want for a successful investment strategy, but it is useful information to help predict the direction of stock prices.

Buying levels in SH as a percent of assets. The Chart is since fund inception. (The Sentiment King)
This pattern of buying in SH is similar to the short selling indicators developed during the last century. A long data history shows that lows in bear markets occurred when there were high amounts of short selling, whereas market tops were typically preceded by low levels of short selling. Again, opposite of what you want.
The six arrows point to the low levels of buying in SH (5% or less) that preceded major market declines. We've also circled the current level of buying, which is 12% of assets. The amount of buying in SH has slowly been coming down from the peak levels of last year when it rose to over 30%.
The Sentiment King is holding to the view that no significant market decline will occur until investors first reduce their purchase level of SH to just 5% of assets. We think this indicator is important, which is why it's one of the nine indicators that make up our Master Sentiment Indicator (MSI).
Assets Under Management in SH Are Contracting
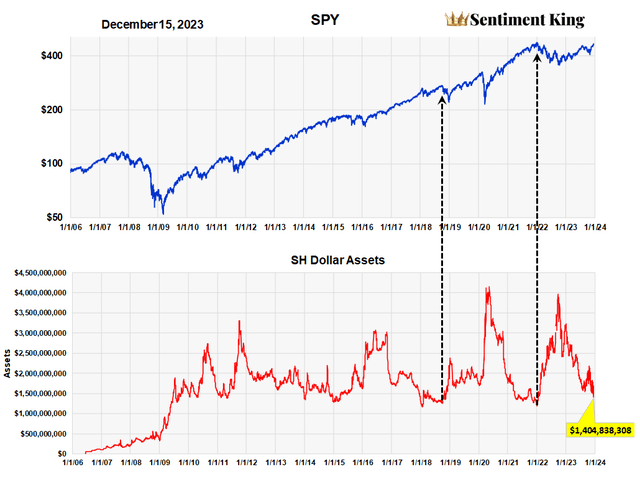
The next chart shows you the pattern of assets under management in SH since inception.

AUM of SH since inception. (The Sentiment King)
Four years after the fund’s inception, AUM settled into a distinct pattern. Much like the previous chart, this chart shows peaks and valleys in AUM moving up and down with bull and bear markets.
The peaks and valleys seem to form a "band." It’s interesting that the amount of money in SH at the lows of the COVID bear market was almost identical to last year's bear market lows. Both occurred when the fund reached $4 billion in assets.
We've indicated with arrows the opposite situation – the low amount of money in this fund at the beginning of the last two bear markets. Assets got down to 1.2 billion dollars. It then stayed at this low level for at least six months before the market finally ran into trouble.
The current amount in the fund is 1.4 billion. This confirms to us that the stock market has higher to go and now is not the time to invest in SH. But it also suggests that the time to invest in SH might not be as far away as many believe.
SH Price Target of $12.20
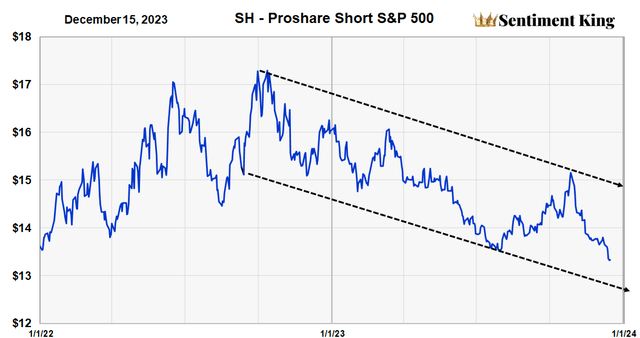
This chart diagrams the trend lines that should contain the price of SH if the market has moved higher and the fund lower.

The NAV of SH (2022-23) (The Sentiment King)
Assuming that the S&P 500 hesitates at its previous peak of 4,800 before it moves higher, we can expect a breakout to new highs and SH hitting the lower trend-line sometime in March or April. This would be a price target of $12.20 for SH.
Disclaimer: Investing carries risk. This is not financial advice. The above content should not be regarded as an offer, recommendation, or solicitation on acquiring or disposing of any financial products, any associated discussions, comments, or posts by author or other users should not be considered as such either. It is solely for general information purpose only, which does not consider your own investment objectives, financial situations or needs. TTM assumes no responsibility or warranty for the accuracy and completeness of the information, investors should do their own research and may seek professional advice before investing.

