PSQ: Too Much Short Selling Points To Even Higher Prices For The QQQ
Summary
- High levels of buying in PSQ as a percent of assets indicate to many investors are expecting a decline in QQQ. This suggests QQQ should keep advancing and PSQ declining.
- The current purchase level in PSQ is four times higher than before previous major peaks, indicating too much investor interest in the short side of the market.
- The dollar assets in PSQ need to contract further before a rally in PSQ can be expected.

Pla2na
With the QQQ finally making all-time highs, many investors are wondering if it's really just a “double top” and time to short the QQQ by buying PSQ.
To answer this, we're going to look at investor activity in PSQ itself, which has guided us before with this question. We’ll update the same internal indicators that we presented in our August 29th article which warned against buying PSQ then. That caution prevented a 7.6% investor loss.
Buying Levels in PSQ Are Still Too High

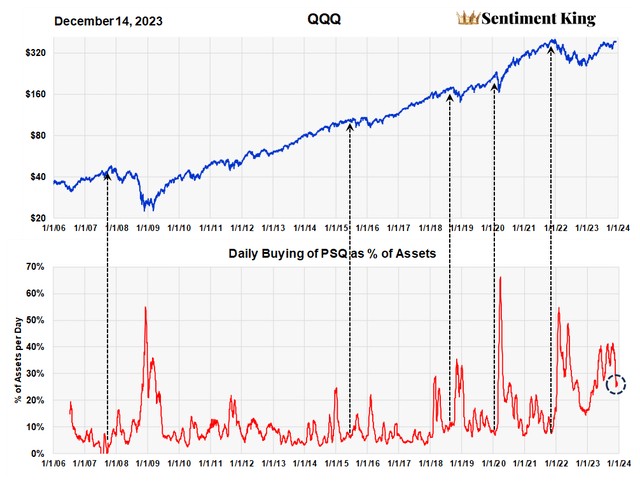
Average Amount of Money Buying PSQ per Day as a Percent of Assets. Buying is Averaged Over 20 Days (The Sentiment King)
The chart above shows average daily buying in PSQ as a percent of assets. Normal buying levels are around 10%. At major lows, the ratio can rise to 50% or more of assets per day. We use this metric like the odd lot short selling indicators of old.
There is a long, eighty-year history which shows that market tops are usually preceded by low levels of short selling, while major bear market lows occurred during high levels of shorting. This activity is opposite of what you would want for investment success.
This same pattern is what you find with the purchase levels in PSQ, which is a ProShare ETF that goes short the QQQ. High levels of buying in PSQ occur near market lows and low levels of buying occur near market tops before a major decline. This again is the opposite of what you would want.
History shows you never start a major decline when there are high levels of buying in PSQ. It signifies that too many investors are expecting a decline and if you believe in contrary opinion, which we do, you're not going to get it.
Using five arrows, we've pointed to the levels of buying in PSQ that existed before major declines. Purchase levels were always less than 10%, sometimes even less than 5%. We've indicated with a black circle the current ratio, which is 25%.
In our opinion, this ratio represents far too much interest by investors in the short side of the market for the market to be at a top. This implies the QQQ is not making a double top at current levels, but will go much higher. It also means that investors should not buy PSQ at this time.
Caution Toward Buying PSQ Confirmed by Absolute Buying Levels
Whenever we use ratios on the market, we like to confirm the metric with the absolute values that form the ratios. In this case, we're going to look at the dollar amount going into buying PSQ to see if it too is elevated. The next chart shows the average amount of money buying PSQ per day.

Daily Dollar Buying in PSQ Averaged Over Twenty Days (The Sentiment King)
Before the two prior peaks in QQQ - during the initial outbreak of COVID and the beginning of 2022 – purchase levels in PSQ had fallen to just $50,000,000 a day. These are indicated by the two arrows.
The current purchase level is just over $191 million a day. This is four times the level that occurred before the two previous major peaks, and confirms the conclusion of the previous chart.
There is simply too much interest in PSQ for the market to be at the top. We advise investors to stay out of this fund for the time being.
Dollar Assets in PSQ Need To Contract More

Total Dollar Assets (AUM) of PSQ Since Inception (The Sentiment King)
This chart shows the dollar assets in PSQ since the funds inception in 2006. As you can see, there was a huge surge of money in the fund in 2022, reaching just over $2 billion dollars. Some of this was due to price appreciation of PSQ, but most was due to new purchases by investors.
You can see that money has been coming out of the fund since last October’s price low. It is now down to $814 million. We don't think investors have to worry about a market decline until the total assets in this ETF have first come back to around 1/2 a billion dollars, as it has in the past (2019-2021).
Price of PSQ Has To Go Lower First

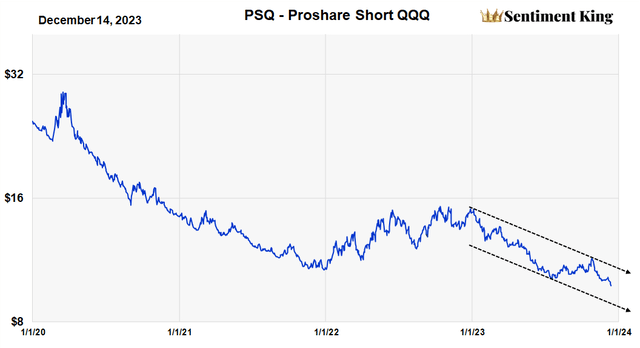
Chart of NAV of PSQ since 2019 (The Sentiment King)
This long-term chart shows the overall tendency of the PSQ NAV to erode over time. It also shows the ETF hitting all-time new lows this week, coincidental with the breakout of QQQ to new highs. We fully expect this decline in the price of PSQ to continue while QQQ continues to make new highs.
The parallel trend lines in the graph show the price band we expect PSQ to follow as it trends lower. The lower band would be at $8.50 by January, which would be a decline of 13% from the current price of $9.79.
Summary
We don't expect a significant long-term rally in PSQ, or a significant decline in QQQ, until buying levels in PSQ first drop to 10% of assets or less. We want to be very clear on this forecast - it's for the long term. Short term, with the market heavily overbought, there could be three or four week rally in PSQ. But we expect lower prices long-term.
Risk Warning
There are unique risks that come with investing in PSQ not found in most other ETFs. There is a constant downward price erosion that increases the longer one holds the fund. This comes from what are called “carrying costs” due to the fact the ETF must use some form of margin.
This risk is especially burdensome now due to the higher than normal interest rates created by the FED to fight inflation. Both the ProShares website and the SEC have detailed messages on the inherent risks using leveraged ETFs.
Disclaimer: Investing carries risk. This is not financial advice. The above content should not be regarded as an offer, recommendation, or solicitation on acquiring or disposing of any financial products, any associated discussions, comments, or posts by author or other users should not be considered as such either. It is solely for general information purpose only, which does not consider your own investment objectives, financial situations or needs. TTM assumes no responsibility or warranty for the accuracy and completeness of the information, investors should do their own research and may seek professional advice before investing.

