Bullish Sentiment Is Rising, But We Still Expect A Market Peak In August
Summary
- The Master Sentiment Indicator has again entered the red zone, indicating extreme bullish sentiment and suggesting a possible sell-off.
- However, it's abnormal not to have at least one correction before a major advance ends. The fact we haven’t had one is strong evidence this advance is not yet over.
- So, we're expecting a short, sudden sell-off, which then reverses and breaks to new highs, with the major advance finally ending sometime this August.

iiievgeniy/E+ via Getty Images
The Master Sentiment Indicator (MSI) - a composite made from nine, established sentiment indicators - has finally moved into the red zone. This means we've entered the zone of extreme bullish sentiment, and it suggests a short-term, market sell off. Why short term and not long term?
Because it's abnormal not to have at least one or two corrections before a major advance ends. The fact we haven’t had one since October is strong evidence we're not yet at the end of this long advance.
So, the Sentiment King is expecting a sudden, short term sell off, which then reverses and breaks to new highs, reaching a final high sometime this August. We explained earlier why we believe August will mark the end of the current market advance.

This speed dial shows the current status of the Master Sentiment Indicator. The MSI measures what investors feel and expect from stock prices. The dial swings between extremes, which we call Red and Green Zone readings. Red Zone readings are extreme bullishness and Green Zone readings represent extreme bearishness. There is a large, grey neutral band between extremes. The current reading of 8.2 has just entered the red zone. (The Sentiment king)
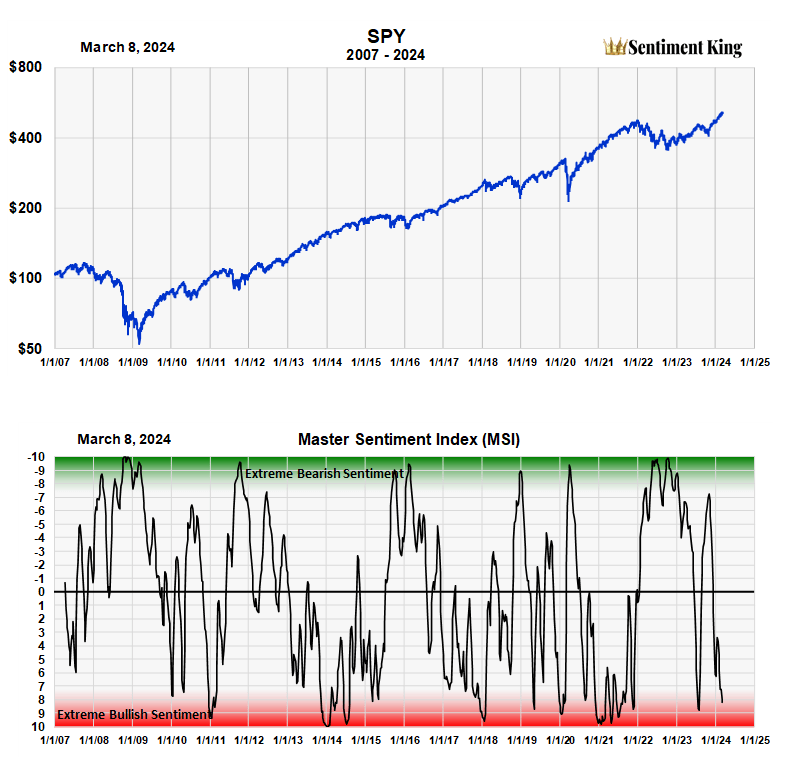
The MSI (Master Sentiment Indicator) is composed of nine classic sentiment indicators fused together using our SK ranking system. The following are the nine indicators that make up the MSI: The CBOE Total Puts and Calls Ratio, The CBOE Equity Puts to Calls Ratio, The CME Commitment of Traders data on the S&P futures, Buying in the ProShares S&P 500 Inverse Fund (SH), NAAIM Exposure Index (National Association of Active Managers), Hulbert Rating Service (Stocks), Hulbert Rating Service (Nasdaq), The AAII Sentiment Survey, and the Investors Intelligence Survey. The red-green chart above graphs the MSI over the last 15 years. Its ability to indicate major market lows is phenomenal and we believe it's better than any economic or financial metric in this regard. (The Sentiment King)
A Second Red Zone Reading
It's a well-known fact that investor emotion and sentiment drive stock prices just as much as economic factors. This is what the MSI seeks to measure, and it shows that investor expectations have reached the red zone, with a reading of 8.2. This is the first time since last August we’ve had a red zone reading, and the second time since the green zone buy signals of 2022.
No Final Top Without At Least One Correction
Does a red zone reading mean the bull market is over? No, but it does mean stock buying is pretty much exhausted and we could have a measurable correction. As we wrote two months ago:
History shows a major advance won't end until investors have first become overwhelmingly bullish. This is an important principle. It doesn't mean prices will decline once you get extreme bullish sentiment; it just means you shouldn't worry about looking for the end of a bull market until it occurs.
One of the mistakes I've consistently made during fifty years of trading is becoming bearish too soon. Following simple rules can sometimes help overcome past mistakes. One useful rule is summarized in the title of this section.
There has been no visible correction since this section of the bull market began last October. While extreme sentiment says a correction is due, the fact we haven't had one strongly suggests it will just be one of the corrections we need before this move ends.
Summary of the Nine Sentiment Indicators of MSI
This update wouldn't be incomplete without reviewing the nine indicators that make up the MSI. They are shown in the table below. We put the current reading of all nine indicators on the Sentiment King ranking scale, which goes from +10 to -10.

The MSI Sentiment King Table. We average each indicate over an appropriate time, then locate it on the Sentiment King ranking scale, which goes from +10 to -10. The ranking is based on where the average is against historic numbers. The final MSI ranking is shown in the far right column. (The Sentiment King)
As you can see most of the indicators based on newsletter writer and investor surveys are in the Red Zone. These include the AAII survey, and the granddaddy of all surveys, the Investor Intelligence survey, with a history that goes back to 1964.
Those indicators based on investor activity, such as the puts to calls ratio and the buying of ETFs that short the market, are not yet near the Red Zone. These three, activity based indicators are the ones holding back the MSI from registering a full-fledged, red zone reading. In other words, while most people say they're bullish, the bearish activity of a significant number say otherwise.
Summary
There is no better tool at locating the highs and lows of major price moves than by measuring what investors are thinking and doing - measuring when you have extreme greed or fear. Using sentiment to locate bear market lows like in 2022 was relatively easy. Using it to locate market tops is much more difficult, mainly because stocks and sectors generally top at different times so there are usually numerous tops.
You can see this by carefully studying the numerous Red Zone readings of the past 14 years. They’re not as clear cut as Green Zone readings. It’s much more an art.
We think the combination of a Red Zone reading and the fact that the market hasn't experienced a correction since October come together to make a statement about this market. They're clearly saying the market will have a correction but will move higher. But probably not a lot higher. Our January projection of 550 on SPY by August is a gain of only 7.5% from here. If there is a 5% correction, it will be a gain of 13% from that low.
We think this way of thinking is much more fruitful, and profitable, than opining on if or when the Fed will lower interest rates.
Disclaimer: Investing carries risk. This is not financial advice. The above content should not be regarded as an offer, recommendation, or solicitation on acquiring or disposing of any financial products, any associated discussions, comments, or posts by author or other users should not be considered as such either. It is solely for general information purpose only, which does not consider your own investment objectives, financial situations or needs. TTM assumes no responsibility or warranty for the accuracy and completeness of the information, investors should do their own research and may seek professional advice before investing.
