Housing Market Crash Is On The Horizon
Summary
- Existing single-family home sales for June fell 5.4% MoM and 4.3% YoY to a 3.5mm SAAR.
- As with new home sales in May, every price bucket declined in all four regions except the $750k-$1mm and over $1mm buckets.
- With respect to potential rate cuts, the median new mortgage payment now requires 41.4% (pre-tax) of the median household income according to the data parsed by Reventure Consulting.

BrianAJackson
Housing market update - Existing single-family home (sales for June, released Tuesday) were nothing short of a disaster. Sales fell 5.4% MoM and 4.3% YoY to a 3.5mm SAAR (seasonally adjusted annualized rate). This is the fourth consecutive month of declining used home sales in what should be the strongest seasonal period of the year for home sales. The not seasonally adjusted, monthly number dropped 6.6% from May and plunged 12.6% YoY. This metric is a more reliable indicator of the YoY trend in sales because it's cleansed of any errors imposed on the data by the NAR's seasonal adjustment calculus.
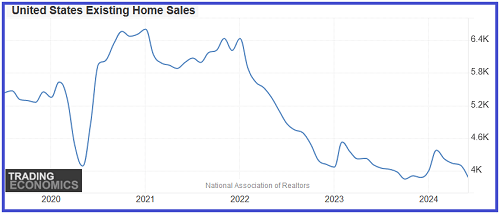
The monthly SAAR has been in decline since January 2021:

Since January 2021, when the existing home sales SAAR was 6.6 million, the metric has plunged 41%. Unsold listings jumped to 4 months' supply, up 29% YoY to the highest level since May 2020. Including condos and co-ops, inventory is at 4.1 months' supply, and it has soared 57.6% YoY.
As with new home sales in May, which I detailed in the July 14th issue, every price "bucket" declined in all four regions except the $750k-$1mm and over $1mm buckets. In the $750k-$1mm bucket, the only region with a YoY increase in sales was the northeast - the bucket declined nationwide. The over $1mm bucket increased 10.9% YoY in the northeast, but was up just 3.6% nationwide.
The NAR Chief Economist commented that "we're seeing a slow shift from a seller's market to a buyer's market." He does his best to put lipstick on Miss Piggy. The reality is that it looks like a hastening shift from a slowing market to an eventual sales and price crash.
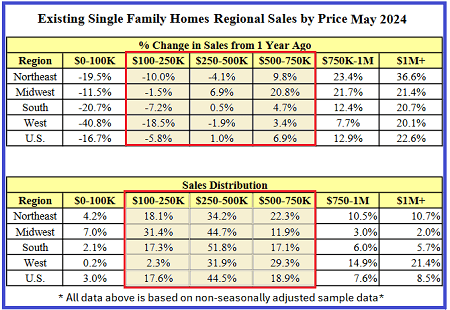
Earlier this month, I did a deep-dive into the May existing home sales report and found a smoking gun. I noticed that the distribution of sales across the six price "buckets" shows a different story than the headline number broken out by sales region:

The table above is from the Supplemental Data link on the National Association of Realtors news release. The data is not seasonally adjusted, monthly data. On a monthly basis for May, the NAR data shows an estimated 364,000 homes (no change YoY) sold in May at a median price of $380,400 (half sold above that price and half below).
The headline numbers, however, are deceptive. Per the top table, the two highest price buckets showed double-digit increases in the number of homes sold YoY while the two lowest price buckets declined YoY. All of the action in the May sales was in the two highest price buckets, while everything below the top two buckets was flat to down. The data reflects the degree to which buying a home or moving up from a starter home has become unaffordable for the majority of households. In fact, Friday's U of Michigan Consumer sentiment report (discussed below) showed that homebuying conditions in June hit a record low for the history of the data series.
Given the recent reports based on Zillow data that many of the previously hottest housing markets are experiencing a huge influx of listings and big price cuts in the listings, in most areas the buyers in the top two price buckets will soon be underwater on their home purchase. Moreover, as the amount of listings piling up in the various MSAs becomes more "visual" to prospective buyers in the two top price buckets, many will hold off buying.
With respect to potential rate cuts, the median new mortgage payment now requires 41.4% (pre-tax) of the median household income according to the data parsed by Reventure Consulting (median household income (Fed) divided by median new mortgage payment (Bankrate)). In the previous housing bubble, this metric topped at 39.3%. This is why I believe it won't change reality for the housing market if the Fed eventually takes rates back to zero. Moreover, the market has already priced the next six rate cuts into the homebuilder valuations.
I have to believe that the actual fundamentals of the housing market will invade the highly overvalued homebuilder stock sector within the next three to six months. The primary driver of the record-low buying conditions is high home prices. I would argue with high conviction that, given the data on household financials, even if the Fed took rates down to zero percent, it would not do much to jump-start the housing market. As such, I think the extraordinarily overvalued homebuilder stocks are among the best shorts on the NYSE.
Editor's Note: The summary bullets for this article were chosen by Seeking Alpha editors.
Disclaimer: Investing carries risk. This is not financial advice. The above content should not be regarded as an offer, recommendation, or solicitation on acquiring or disposing of any financial products, any associated discussions, comments, or posts by author or other users should not be considered as such either. It is solely for general information purpose only, which does not consider your own investment objectives, financial situations or needs. TTM assumes no responsibility or warranty for the accuracy and completeness of the information, investors should do their own research and may seek professional advice before investing.

