Stanley Black & Decker Might Have Found Its Bottom
Summary
- Quarterly results show a decline in revenue but an increase in free cash flow, with the Tools & Outdoor segment performing better than the Industrial segment.
- Balance sheet analysis reveals still higher debt levels, but we are seeing progress in reducing the debt levels, and management will continue to put a focus here.
- Management focused on cost reduction programs and gaining market shares, with updated guidance showing mixed results but optimism for future growth.
- At this point, Stanley Black & Decker can be seen as a cautious "Buy" with the stock being undervalued.

JHVEPhoto
It has been almost two years since I published my first and only article about Stanley Black & Decker, Inc. (NYSE:SWK) in August 2022. Back then, I wrote in my conclusion:
In my opinion, we can call Stanley Black & Decker at least fairly valued right now as it seems to be trading below the calculated intrinsic value - even when using rather cautious assumptions. Nevertheless, the probability for a recession and bear market that is still upon us is rather high. I would assume the stock to decline further in such a scenario and if the stock should decline further, a good entry point would be around $65-70. Despite being a "Buy" from a fundamental point of view, I would rate the stock as "Hold" as I expect lower stock prices in the coming quarters.
And although the stock has not reached the entry point I mentioned in my last article, the stock declined in the meantime. However, the rally in the last few weeks actually led to the stock now trading 22% higher compared to August 2022 when my last article was published. Although the stock underperformed the S&P 500 (SPY), which gained about 31% in the same timeframe, I will provide an update on the business in the following article and answer the question once again if Stanley Black & Decker is a good investment right now.
Quarterly Results
On July 30, 2024, Stanley Black & Decker reported second quarter results and revenue declined once again from $4,159 million in Q2/23 to $4,024 million in Q2/24 - resulting in a 3.2% year-over-year decline. And compared to $1.18 in earnings per share in the same quarter last year, the company reported a loss per share of $0.07. Only free cash flow increased from $196 million in the same quarter last year to $486 million this quarter resulting in 148% year-over-year growth.
Stanley Black & Decker Q2/24 Presentation
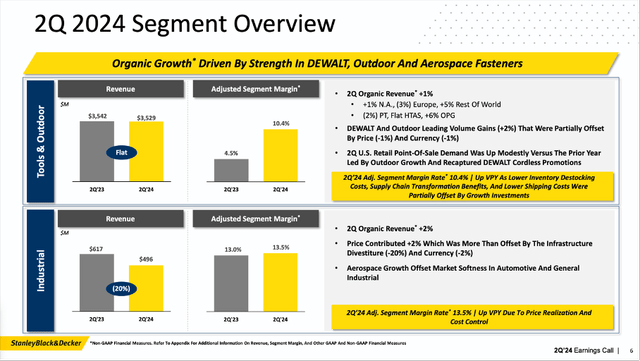
The company is reporting in two segments. The Tools & Outdoor segment is the largest segment among the two and generated $3,528.7 million in revenue (almost 88% of total revenue in this quarter). And while revenue for the segment declined slightly (0.4% year-over-year), operating profit increased from $102.0 million in the same quarter last year to $316.1 million this quarter. However, it was rather the same quarter last year which was the outlier.
The second segment - Industrial - generated $495.7 million in revenue resulting in a 19.6% year-over-year decline. The segment profit also declined from $71.6 million in the same quarter last year to $66.8 million this quarter.
Balance Sheet
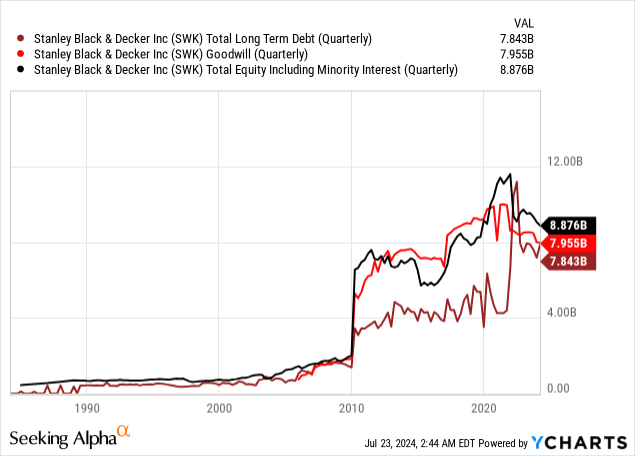
In my last article, I also mentioned that the balance sheet was certainly not perfect for Stanley Black & Decker, and therefore we take another look. On June 29, 2024, the company still had $492.2 million in short-term borrowings, $500.1 million in current maturities of long-term debt as well as $5,602 million in long-term debt on the balance sheet resulting in $6,594 million in total debt.
 Data by YCharts
When comparing the total debt to total shareholder's equity of $8,722 million we get a debt-equity ratio of 0.76, which seems acceptable. However, this metric might be a little bit misleading. First, a huge part of the company's assets is goodwill and other intangibles of $11,802 million (this time, Stanley Black & Decker did not disclose goodwill numbers). Last quarter, goodwill was $7,955 million and this is not an asset we like to see on the balance sheet.
Second, we should rather compare the total debt to either the operating income or free cash flow to see how long it will take the business to repay the outstanding debt. Free cash flow as well as operating income were around $800 million in the last four quarters, and therefore it would take a little more than nine years to repay the outstanding debt - this is too long to be acceptable.
We can point out that Stanley Black & Decker has $318.5 million in cash and cash equivalents on the balance sheet, which can be used to reduce debt. Additionally, we can make the argument that Stanley Black & Decker can generate a larger amount of free cash flow and operating income again. In optimistic scenarios, amounts of $1.5 billion annually seem realistic, and then it would take about four years to repay the outstanding debt - an acceptable metric.
Summing up, the balance sheet of Stanley Black & Decker is certainly not perfect, and debt levels are a bit high, but there is also no reason to be really worried. And management stated once again during the last earnings call and in its presentations that reducing debt remains one of the top priorities.
Cost Reduction and Gaining Market Shares
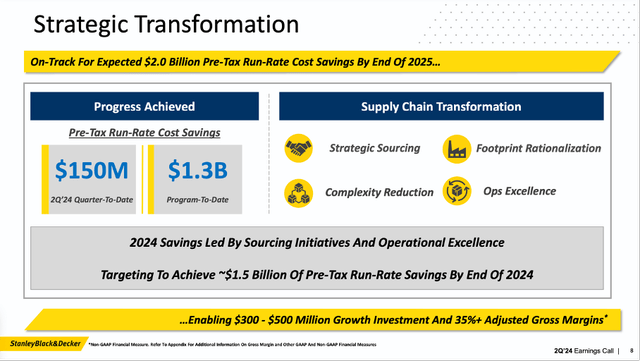
Aside from focusing on reducing debt levels, management is also focused on its cost reduction program. During the previous earnings call, management stated that the cost reduction program remains on track for an expected run rate savings of $1.5 billion by the end of 2024. By the end of 2025, the expected run rate is even $2 billion. During the earnings call, management commented:
I would like to highlight the progress we've made along our transformation journey in the first quarter. We achieved approximately 145 million pre-tax run rate cost savings in the period, bringing our aggregate savings to approximately 1.2 billion since program inception. As we focus our portfolio, streamline our business structure and transform our operations, our teams are actively identifying and prioritizing opportunities to further optimize our cost structure.
And of course, trying to cut costs is nothing bad, and every business should constantly assess where it could lower costs and save money. But in my subjective experience, it is never a good sign when a company is especially focusing on cost reduction programs. It usually means the company is struggling and not really able to grow its top line. As a reaction to a struggling business, management is often focusing on cost reductions and is focusing on these cost reduction programs in its presentations and earnings calls. Of course, this does not mean that cost reduction programs are a bad idea, but whenever a business is focusing so much on cost reduction, it could make sense to pay attention to top line growth and how well the business is performing otherwise. Because often when a business is focusing on cost reduction it is trying to shift the focus away from problems on other fronts. The cost reduction programs are often intended to demonstrate that management is doing whatever it can to fuel bottom line growth again.
Stanley Black & Decker Q2/24 Presentation
But management is not only trying to cut costs to improve its bottom line, it is also optimistic about gaining market shares, which is a good sign that the company will also be able to grow its top line again in the years to come. During the previous earnings call, management stated:
Our long-term success will be driven by improved profitability, coupled with consistent market share gains. We believe our share position in tools is now stable to increasing. For example, our 2023 point-of-sale data in tools performed better than the category average across the North American home centers, which was led by our iconic DEWALT Professional brand. We are also serving our customers better by delivering improved fill rates, earning the right for more activity across our brands. Retailers are recognizing this performance.
Guidance and Growth
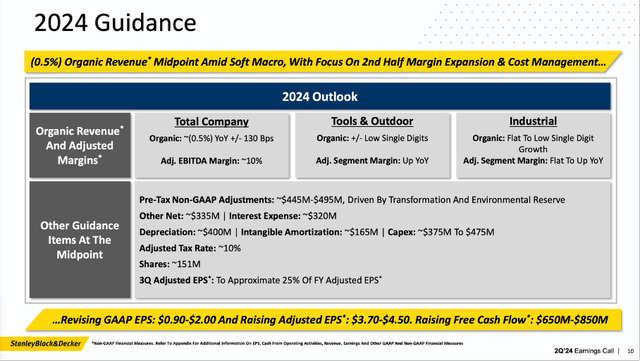
But we also must point out that during the last earnings call, I rather had the feeling that management focusing less on its cost reduction program (which is still ongoing) and rather on other topics again. This is also reflected by management being able to update its 2024 guidance and GAAP earnings per share are now expected to be in a range of $0.90 to $2.00. The previous guidance was from $1.60 to $2.85, and the company therefore lowered its guidance for this item. However, when looking at the adjusted earnings per share, Stanley Black & Decker raised its lower end of the guidance from previously $3.50 to now $3.70. The upper end of the guidance remains at $4.50. And free cash flow guidance was also raised from $600 million to $800 million in the previous guidance to a range of $650 million to $850 million now. It is interesting to see that the range for GAAP as well as non-GAAP earnings per share is very broad indicating that management has difficulties to provide a narrower guidance.
Stanley Black & Decker Q2/24 Presentation
And for the next few years, analysts are quite optimistic and expect high double-digit growth. However, it will take the company a few more years to achieve similar earnings per share again as in fiscal 2022.
Technical Chart
When looking at the chart in the last few weeks, we see the stock rallying from about $77 at the beginning of July to about $102 at the time of writing, resulting in an increase of 33% in about one month. And it seems like the earnings release added fuel to the fire, and we can be quite optimistic that the stock might have found its bottom.
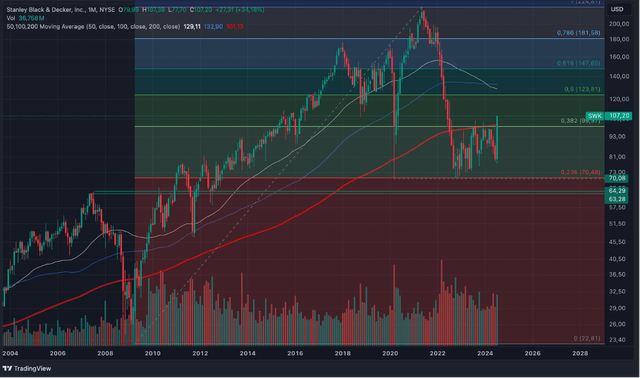
Stanley Black & Decker Monthly Chart (Author's work created with TradingView)
However, when zooming out and looking at the monthly chart, the stock still seems to be caught in a corrective pattern that can be interpreted as a bearish flag and such a chart pattern is rather indicating lower stock prices to come. If the trend continues, and we see a second downward wave we might also see much lower stock prices in the coming quarters. Of course, it is also possible for the stock to break out to the upside but speaking in probabilities a further decline seems more likely. And I don't know if the second quarter results, which were solid but still not so great, are enough to turn sentiment around.
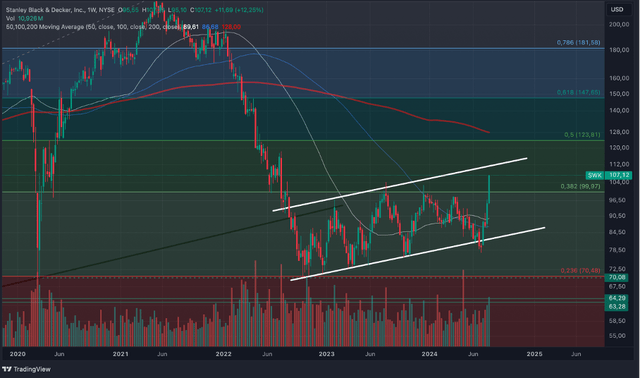
Stanley Black & Decker Weekly Chart (Author's work created with TradingView)
We can make one counterargument here. In late June 2024, we saw the stock trying a false breakout. When connecting the lows of the current flag patterns, the stock tried to break out to the downside, but it failed and a rally followed. This can be seen as rather bullish and would speak for higher stock prices. Of course, the stock has to overcome the above-mentioned resistance levels first.
Intrinsic Value Calculation
A last step, which is almost always included in a sound analysis is the calculation of an intrinsic value. I often look at the P/E and P/FCF ratios in the last ten years to get a feeling for which valuation multiples the stock is trading right now and for which valuation multiples it traded in the past. But as the trailing twelve months earnings per share have been negative for several months now, we can't calculate a reasonable P/E ratio. And right now, the stock is trading for 22.5 times free cash flow, but when looking at the chart it has fluctuated wildly in the past decades, and it is difficult to draw reasonable conclusions.
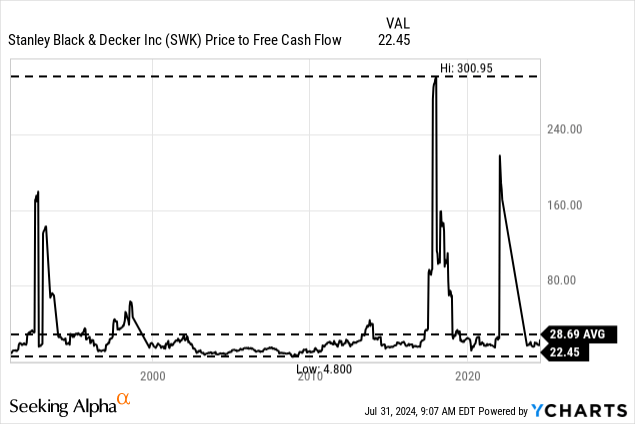 Data by YCharts
Instead, we calculate an intrinsic value by using a discount cash flow calculation. In my last article I calculated with rather optimistic assumptions and used the company's own long-term targets. Management was expecting EPS to grow 10% over the long run. However, in the last ten years, Stanley Black & Decker grew revenue only with a CAGR of 3.67%. Of course, the last ten years were maybe not representative for Stanley Black & Decker as the company could grow with much higher rates in the past, and at least for fiscal 2025 and 2026, analysts are expecting extremely high growth rates.
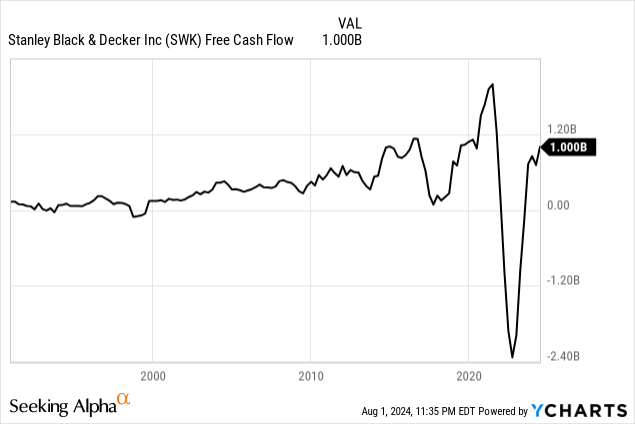 Data by YCharts
At this point, I would calculate 6% growth for the next ten years, which seems to be the midpoint between the actual growth rate in the last ten years and the optimistic assumptions of management. And I will also take the free cash flow of the last four quarters as a basis (which was $1,000 million) and as this is a rather low amount due to the struggling business in the last few years, it seems realistic for the business to grow with a much higher pace in the next few years (this would basically be a reversion to the mean). Additionally, we are calculating with a 10% discount rate and 150.9 million shares outstanding. Calculating with these assumptions leads to an intrinsic value of $165.67, and we could call the stock undervalued at this point.
Conclusion
In my last article, I wrote that the stock could go lower (and it did go lower in the meantime). And I also wrote above that - from a technical point of view - the stock might also decline lower as the current chart pattern can be interpreted as a bearish flag. Nevertheless, I would be rather bullish at this point as I see signs of the business turning around.
Not only is the company most likely undervalued from a fundamental point of view, but management also raised its guidance, which is a positive sign. And from a technical point of view, we might have witnessed a false breakout on the lower end of the bearish flag, which resulted in a rally to the upside - a rally that could continue in the coming months.
One strategy here could be to wait for the stock to break out above $115 to $120 (the range where most resistance levels currently can be found). Once the stock manages to move higher, we can be more bullish and probably have more confirmation that a bottom was found for the stock. Of course, we also must pay a higher price for the stock, but that is the trade-off everybody has to make for him- or herself.
Disclaimer: Investing carries risk. This is not financial advice. The above content should not be regarded as an offer, recommendation, or solicitation on acquiring or disposing of any financial products, any associated discussions, comments, or posts by author or other users should not be considered as such either. It is solely for general information purpose only, which does not consider your own investment objectives, financial situations or needs. TTM assumes no responsibility or warranty for the accuracy and completeness of the information, investors should do their own research and may seek professional advice before investing.

