The Housing Market Is Crashing - Rate Cuts Won't Help
Summary
- The pending home sales index for July rose 4.8% in June from May but declined 2.6% YoY.
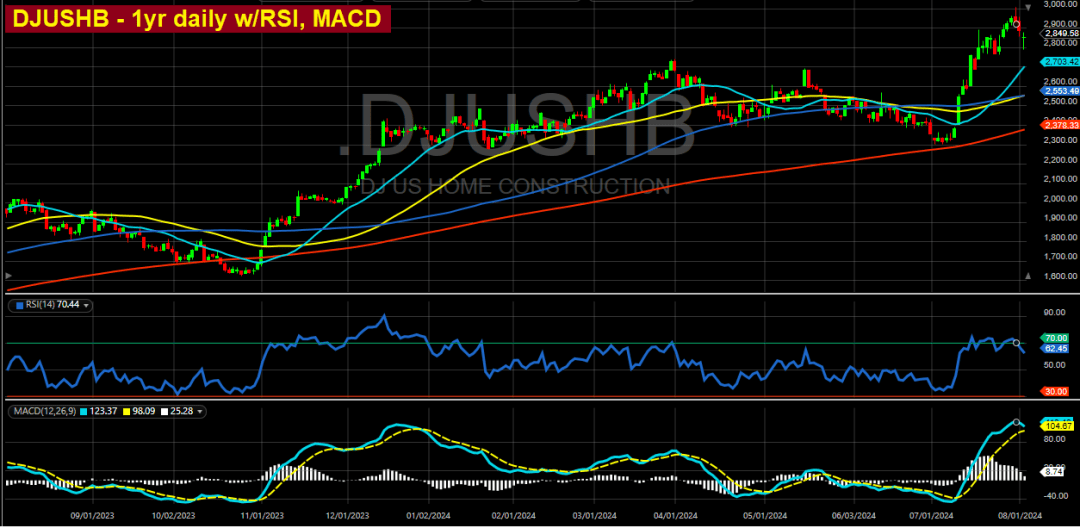
- The Dow Jones Home Construction index looks to be rolling over from an irrational move higher since July 9th plus the RSI and MACD are heading south from overbought readings.
- Beazer Homes reported its FY Q3 numbers on Thursday after the close. Revenue increased 4% YoY due to a 4.4% YoY increase in closings. However, that’s it for the positive aspect to the numbers.

Justin Paget
The following commentary is from the August 4th issue of my Short Sellers Journal weekly newsletter. The charts below are through August 2nd.
Housing market update
Redfin posted data this past week that reflects the degree to which home sales activity is tanking. In June, 15% of home purchase contracts were canceled and 20% of listings nationwide had price cuts. Both metrics are the highest on record for June. In addition, and this is pertinent to CRE and multi-family housing (ABR), new apartments are taking longer to rent out because a near-record of them are hitting the market (new con-struction multi-family units).
The pending home sales index for July rose 4.8% in June from May but declined 2.6% YoY. The not-seasonally adjusted numbers showed a 7.8% decline YoY. That comp likely is more reflective of the YoY decline because it doesn’t contain statistical errors in the “adjustments” calculus. The July increase over June is likely just a statistical bounce because the pending home sales index had been trolling record low levels going back to 2001, which is when the data series began. It also correlates with the brief bounce in mortgage purchase applications during mid-June. Pendings are based on contracts signed during June.
Speaking of the weekly mortgage purchase index, it slid to 132.8 which is the lowest level since the week ending May 31st when it hit 132.3. The index continues to press its lowest level since 1995. On a not seasonally adjusted basis, the index is down 14% YoY. It’s down 24.1% since January 19th. Again, the housing market is still in its strongest seasonal period of the year. After that brief bounce in June, it’s been in a sharp downtrend and reflects the growing weakness in home sales activity despite the rapidly rising inventory of new and used homes.
It looks like the homebuilders may be headed south. The Dow Jones Home Construction index looks to be rolling over from an irrational move higher since July 9th plus the RSI and MACD are heading south from overbought readings:

The caveat with the builders is that the 10-year yield plunged 40 basis points last week from 4.19% to 3.79% on Friday. I don’t know if the hedge fund algos will start to buy homebuilders if the 10-year yield continues to fall. On the other hand, the market may continue dumping homebuilders based on the recent plethora of economic news showing a weaker than previously perceived economy. Certainly, the market can not ignore the extreme overvaluation in the homebuilders if the new and used home sales numbers continue to head south.
Beazer Homes (BZH – $28.57) reported its FY Q3 numbers on Thursday after the close. Revenue increased 4% YoY due to a 4.4% YoY increase in closings. However, that’s it for the positive aspect to the numbers. The gross margin declined 310 basis points YoY, which means the company either had trouble controlling building material and labor costs or offered big incentives to induce buyers – or both. Operating income plunged 38.2%. New orders fell 10.8% YoY and the cancellation rate jumped to 18.6% vs 16.1% in FY Q3 2023 and from 16.2% through the first half of its FY this year. The Company did not offer Q4 guidance.
Looking at the balance sheet, cash fell to $73 million from $132mm in FY Q2 2024 and $345 million at the end of its FY 2023. The inventory jumped 23.6% from FY 2023 year-end, and it was up 5.5% vs FY Q2. The 10-Q has not been released yet, but BZH’s operations burned $239mm in cash through 1H FY 2024. With the $117mm increase in inventory, it must have burned cash in its Q3. Total debt increased by $46mm from Q2 and $91mm from FY 2023 year-end.
The numbers are going the wrong way for Beazer. Based on the drop in new orders, revenues will soon be heading south, profitability has been hammered, cash is evaporating, inventory is rising, the cancellation rate is rising and the operations are burning cash. It won’t be long before BZH will have to start writing down the value of the inventory with which it will be stuck.
BZH’s chart looks far worse than the chart of the DJUSHB above:

I bought BZH puts ahead of earnings starting on the previous Friday (7/26). I added to my position Wednesday and Thursday. I booked profits on those Friday morning because they were in-the-money, and I rolled some of the profits into August 16th $28 puts. I’m actually hoping the stock bounces because I’d like also to have a longer-dated, OTM put position. Like December or February $25 puts (February 2025 is the longest put series right now).
Editor's Note: The summary bullets for this article were chosen by Seeking Alpha editors.
Disclaimer: Investing carries risk. This is not financial advice. The above content should not be regarded as an offer, recommendation, or solicitation on acquiring or disposing of any financial products, any associated discussions, comments, or posts by author or other users should not be considered as such either. It is solely for general information purpose only, which does not consider your own investment objectives, financial situations or needs. TTM assumes no responsibility or warranty for the accuracy and completeness of the information, investors should do their own research and may seek professional advice before investing.

