SP500: The Bounce Is Stalling, Nvidia To Trigger The Next Leg Down
Summary
- The S&P500's recent bounce has stalled, and the next leg lower is likely approaching.
- The specific trigger for the next leg lower could be the Nvidia earnings report on Aug. 28th.
- Ultimately, the S&P500 is facing a recessionary bear market, and the recent volatility is in the process of topping.

baona/iStock via Getty Images
The bounce has stalled
The V-shaped bounce from the early August selloff in the S&P500 (SP500) has extended nearly to the all-time highs. However, it seems like the bounce has now stalled, and the next leg lower is likely approaching. The specific trigger for the next leg lower could be the NVIDIA Corporation (NVDA) earnings to be released on August 28th. Here is the chart for S&P500:
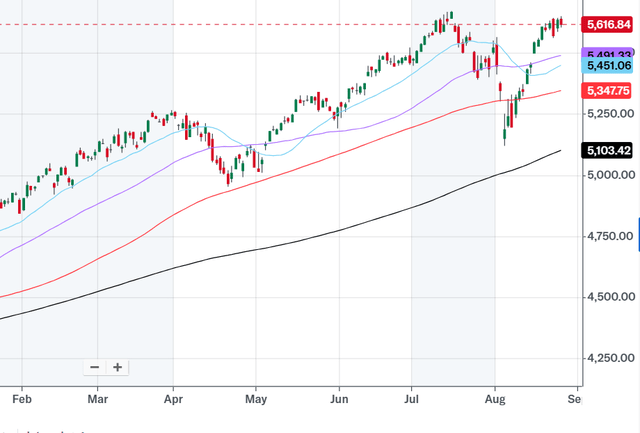
S&P500 (Yahoo)
An imminent recession trigger
Let's review the current macro situation and explain the bear case, which is why the next leg lower might be imminent as the current bounce fades. The early August selloff was triggered by the release of the July labor report, which showed that the unemployment rate increased to 4.3% - above expectations.
The increase in the unemployment rate triggered the Sahm Recession indicator, which suggests that the recession is imminent once the unemployment rate increases by 0.5% from the low point, based on three-month averages. The unemployment rate bottomed out at 3.4%, and now it's at 4.3%.
Once the Sahm rule was triggered, the traders increased their bets on an imminent and aggressive monetary policy easing - which is what happens when the recession starts.
This is a chart of 2Y Treasury Note futures. The expected monetary policy is embedded in the 2Y yields. When traders expect Fed cuts, the price of 2Y Treasury Note futures rises (that's what the graph below shows), which means the yields are falling.
The graph below shows the sharp spike in 2Y Treasury Note futures after the July labor market report, which priced even an emergency Fed cut. However, the bets for aggressive easing subsided as the recent labor market data (the initial claims) eased the imminent recession worries. Yet, the traders are still pricing a substantial and imminent monetary policy easing - and that's consistent with a recession.
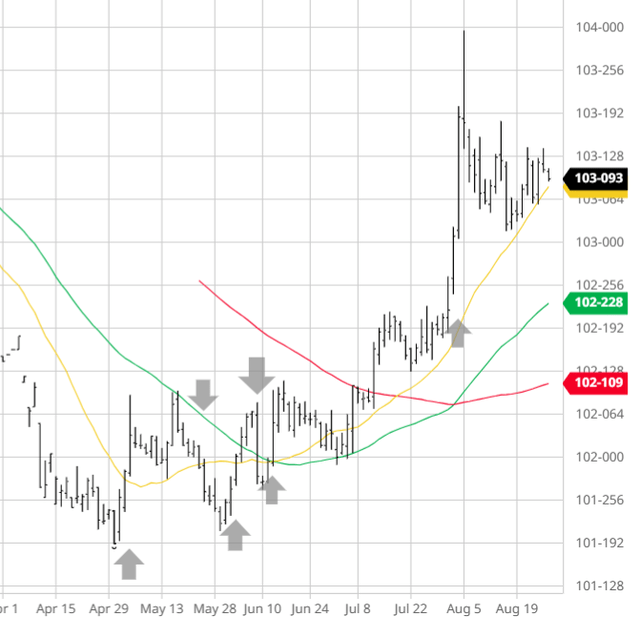
2Y TNote Futures (Barchart)
The VIX and the Yen
The July labor report triggering an imminent recession worry caused a very sharp spike in the VIX Index, which is based on the option prices, in this case specifically the S&P500 (SPX) put prices.
Traders hedged the expected drop in the S&P500 due to 1) an imminent recession, and 2) the GenAI bubble burst (explained later) by rushing to buy put options, which boosted the VIX index nearly to the Lehman Brothers highs.
Given the more assuring labor market data since, and the stabilization in the 2T Treasury Note futures (as discussed earlier), the VIX fell back to the pre-spike levels.
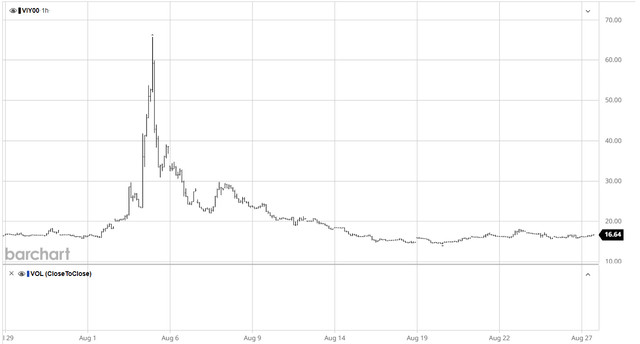
VIX (Barchart)
The expectations of the Fed's aggressive monetary policy easing, together with a more hawkish Bank of Japan monetary policy triggered the Yen Carry Trade blowup and a sharp rise in the Japanese Yen (FXY) - after the July labor market report.
Since the Yen also stabilized, but it continues to trade above the key technical levels, and it's approaching the early August highs.
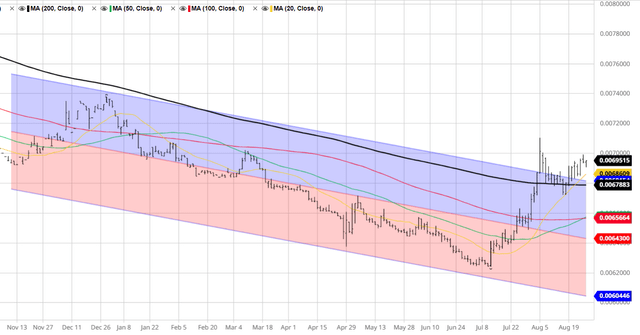
The Yen (Barchart)
The Nvidia bubble burst and the bounce
The sudden pricing of a recession, given the rise in 2Y Treasury Note futures, and the rise in the Japanese Yen, forced traders to exit the speculative trades related to the Gen AI theme, specifically Nvidia.
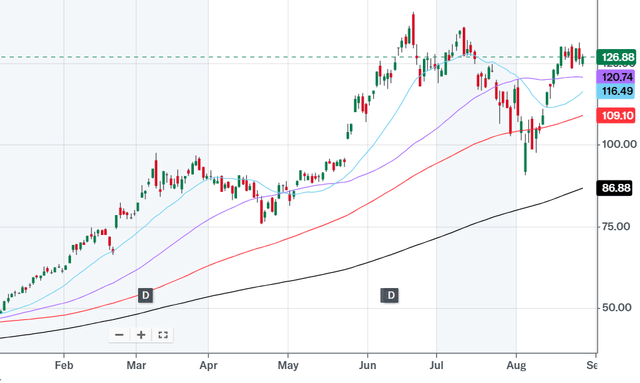
As the chart below shows, Nvidia peaked on June 20th at 140 intraday prices, and fell to a 90-intraday low on August 5th - that's a 36% drop based on intraday levels. For all purposes, the Nvidia bubble busted already.
However, as 1) 2Y Treasury Note futures stabilized, 2) VIX fell from the peak, and 3) the Japanese Yen stabilized, Nvidia bounced back sharply to 130, that's a 44% bounce from the intraday lows of 90.
It is important to note that Nvidia accounts for 7% of the S&P500, so the bounce in Nvidia is the primary cause of the bounce in the S&P500. More importantly, the bounce in Nvidia caused the bounce in the AI-related tech mega-caps, which account for over 33% of the S&P500.
NVDA (Yahoo)
In addition, the bounce in Nvidia pushed up other semiconductors (SMH), which caused the bounce in the Nasdaq 100 (QQQ).
Thus, the bounce in Nvidia was significant in explaining the broad market bounce since the early August selloff. The chart above shows that Nvidia bounce has also stalled, which explains the stall in the SP500 bounce.
The next leg lower in the S&P500 is likely to be driven by the next leg lower in Nvidia - and Nvidia is about to report earnings on August 28th.
My expectations are that Nvidia could beat the earnings estimates because the GenAI capex has been strong, but the problem could emerge with the guidance. There are several issues, such as Blackwell's delay and increased competition. But most importantly, the expected growth in revenue doesn't support the PS multiple of 40. Even if everything is perfect at the Nvidia earnings call, the valuation is still a concern, especially if the economy is about to slip into a recession. In fact, that is why Nvidia declined by 36%, before the bounce. I expect that Nvidia's downturn will resume after the earnings, which is likely to cause the resumption of the downtrend in the S&P500 as well.
Implications
The early August selloff in the S&P500 was due to expectations of an imminent recession.
The recent bounce in the S&P500 was likely due to the general stabilization in the macro environment after the selloff (falling VIX, falling Yen, expectations of less aggressive Fed cuts), and the bounce in Nvidia.
However, the Yen has been rising again, and the VIX has increased from just above 14 to over 16 currently. Thus, the environment is deteriorating. The Nvidia earnings will be the next trigger - and in my opinion, it will be a negative trigger that causes the next leg lower in the S&P500.
The bottom line is that the S&P500 is facing a recessionary bear market (irrespective of Nvidia earnings) and the recent volatility is just a process of topping.
Disclaimer: Investing carries risk. This is not financial advice. The above content should not be regarded as an offer, recommendation, or solicitation on acquiring or disposing of any financial products, any associated discussions, comments, or posts by author or other users should not be considered as such either. It is solely for general information purpose only, which does not consider your own investment objectives, financial situations or needs. TTM assumes no responsibility or warranty for the accuracy and completeness of the information, investors should do their own research and may seek professional advice before investing.

