We Believe It's Time To Sell Long-Term Treasury Bonds
Summary
- We recommend selling intermediate to long-term treasury bonds, specifically the zero coupon ETF EDV, due to the high risk indicated by the Hulbert bond market survey.
- Our asset allocation now includes 50% stocks, 10% bonds, 5% gold, and 35% cash equivalents, reducing exposure to bonds and gold.
- Despite the Fed's plan to lower short-term rates, we anticipate rising long-term rates, leading to lower bond prices and a weak market.
- The inverted yield curve and market forces suggest a transition to a normal yield curve, further supporting our decision to reduce long-term bond holdings.

Spencer Platt/Getty Images News
We believe it’s time to sell long-term treasury bonds. Our original recommendation made last October 23rd was to buy NYSEARCA:EDV, the zero coupon ETF. That's because we were looking for capital appreciation, not income, and this would produce the greatest total return.
Since our October recommendations, EDV has gained 26.5%, GLD has increased 30%, while the S&P 500 has gained 32.7%. So, during the year long bull market, our conservative allocation of stocks, long-term bonds and gold, did well.
But it's time to sell. Our sentiment readings for both bonds and gold strongly suggest significant price risk for these two assets. This article will look at why we believe it’s time to sell EDV and other long-term treasury bonds. Gold will be covered in another article.
It’s Time To Sell Treasury Bonds and ETFs With Duration's Over Seven Years
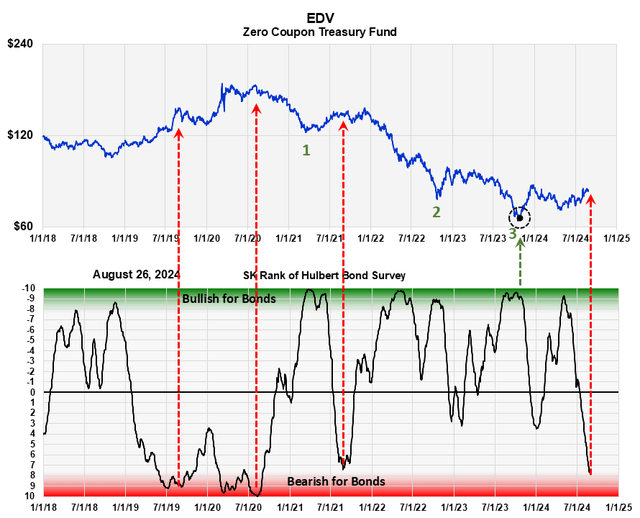
Below is the same graph we used to forecast bonds last October, only updated. The top graph is a six-year chart of EDV. The lower graph shows the Sentiment King ranking of the Mark Hulbert bond market survey. He keeps track of the number of newsletter writers and advisors who are bullish or bearish on bonds. His records go back to before 2000.

This graph charts the zero coupon treasury ETF EDV against our ranking of the Hubert survey of bond market newsletter writers and advisors. The survey has a history back to 2000. Green Zone readings represent high bearish sentiment, which is bullish for bond prices and Red Zone readings represent extreme bullish sentiment, which is bearish for bonds. It acts as a contrary opinion indicator and shows the strong correlation of bond prices with advisor sentiment. The current Red Zone reading indicates caution for the price of long term bonds. (The Sentiment King)
Green Zone readings represent high levels of bearish sentiment, which is bullish for bond prices, and Red Zone readings represent extreme bullish sentiment, which is bearish for bonds. It acts as a contrary opinion indicator.
The black circle and green arrow on the chart point to our EDV recommendation in October. That recommendation was based on the indicated Green Zone reading and the fact that there were three distinct selling waves marked 1, 2 and 3 in green on the chart. That combination – strong bearish sentiment and three distinct long-term selling waves – was a strong indication it was time to buy treasury bonds.
Now, a year later, we are getting a Red Zone reading. We've marked with red arrows three previous times we had Red Zone readings. Each represented high-risk areas for bond prices.
What particularly bothers us now, with this latest Red Zone reading, is how feeble the EDV price advance has been as the sentiment indicator has swung from the Green Zone into the Red Zone. This is indicative of a weak market. So we recommend selling EDV, and other long-term treasury bonds, and reduce risk.
You would think a person would need something more esoteric than "advisor sentiment" to confidently forecast the price of treasury bonds - something deep, economic and scholarly. But after 50 years of looking, I've never found it. If anyone has a metric that has historically predicted the highs and lows of treasury bond prices better than the Hulbert survey, please show me. I would love to present it, and add it to the arsenal.
But How Can Treasury Bonds Go Down If The Fed Is About To Lower Interest Rates?
It’s a mathematical certainty that treasury bond prices will rise if interest rates decline, and the Fed Chairman just said they plan on lowering rates. So, how can we forecast lower bond prices if the Federal Reserve Board is about to lower interest rates? Isn’t that comparable to violating the law of gravity?
Not really. One must understand that the Federal Reserve Board plans on lowering short-term rates, not long-term rates, and it's long-term rates that determine bond prices.
The Fed can only affect long-term rates through some form of quantitative easing program, and there's been no indication of a plan to do that. So, market forces will drive long-term rates (bond prices), not FED actions.
As the Fed lowers short-term rates, we believe free market forces will increase long-term rates just as the Hulbert Survey implies. Let's see how that might happen.

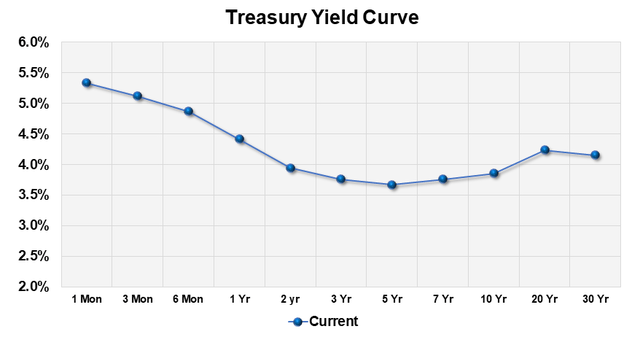
Current (8-28-24) Yield Curve of the Treasury Bond Market (The Sentiment King )
The chart above shows the current yield curve of treasuries. A yield curve displays the different yields you earn from treasury bonds at different maturities. The pattern you see with higher short-term rates on the left, and lower long-term on the right, is unusual and is called an inverted yield curve.
Normally, long-term rates are higher than short term. You get an inverted yield curve only when short-term rates are being manipulated by the FED, or market conditions are temporarily out of balance. When the Federal Reserve lowers the Fed Funds rate, it will lower the left side of the curve, not the middle or the right side.
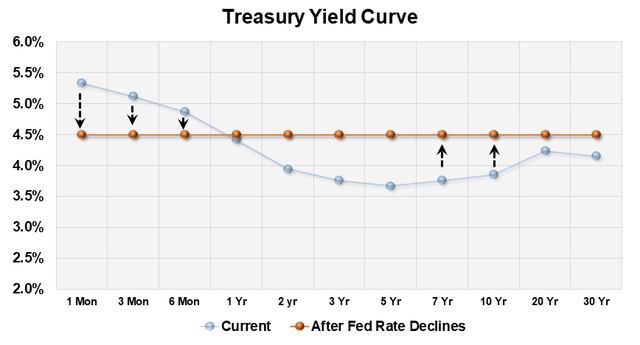
This next chart shows what, we think, will happen if they dropped short-term rates ¾. It’s a schematic diagram and not to be taken literally. The crossover point will probably be around 5 years, not one year as in the schematic. We believe rates will come down on the short end but rise at the long end, as the yield curve begins its transition from inverted to flat, on its way to becoming normal. An increase in yields between 10 years to 25 years as shown, would cause bond prices, like the price of EDV, to decline.

A Schematic of a Rise in Long Term Rates and The Flattening of the Yield Curve as the FED Lowers Short-Term Rates (The Sentiment King)
So, a large decline in the Fed Funds rate doesn't preclude a rise in long-term rates and lower bond prices, as the Hubert survey suggests. This is why we're reducing our allocation of long-term bonds even as the Federal Reserve plans to lower short-term rates.
Summary
We specifically recommend investors sell EDV and other long-term bond ETFs. We believe many investors have invested in long-term treasury bonds this year with the expectation of capital gains when interest rates decline. We think this advice is misplaced. Yes, short-term rates will decline, but we believe investors are going to see long-term interest rates rise, and therefore bond prices, decline.
Disclaimer: Investing carries risk. This is not financial advice. The above content should not be regarded as an offer, recommendation, or solicitation on acquiring or disposing of any financial products, any associated discussions, comments, or posts by author or other users should not be considered as such either. It is solely for general information purpose only, which does not consider your own investment objectives, financial situations or needs. TTM assumes no responsibility or warranty for the accuracy and completeness of the information, investors should do their own research and may seek professional advice before investing.

