It's Time To Sell More Gold
Summary
- We initially recommended a 100% gold allocation, then reduced it to 70% in April, and now suggest 50% due to our sentiment indicators forecasting an intermediate term correction.
- Gold has reached our $2,450 price target, and technical indicators suggest the current two-year rally is fully extended.
- Excessive "call" versus "put" buying in GLD, and high optimism among gold advisors, indicate a peak, supporting our intermediate-term correction outlook.
- However, our long-term gold indicator remains bullish, so we maintain a 50% gold allocation, anticipating a potential buy-back opportunity within the next year.

brightstars
A year and a half ago, we recommended investing in gold to 100% of one's allocation. In other words, whatever the amount of money allocated to gold, now was the time to go to 100% of that allocation.
Then, in this article in early April, because of growing bullish sentiment, we recommended investors lighten their gold investment to 70% of allocation. We gave a maximum price target of $2,450 based on gold rising to the upper end of its parallel trend channel. We have now reached and surpassed that price target.
Evidence strongly suggests that an intermediate term correction in gold is even more imminent, so we're now recommending going to 50% of allocation. (We are not comfortable going 100% into cash because our long-term gold indicator is somewhat neutral, and we're willing to wait to see how that develops).
We believe we'll be able to go buy back those gold positions at a lower price sometime over the next year. In this article, we'll review the same indicators we presented in April and show you where they stand today.
Gold Has Reached Our Price and Time Targets
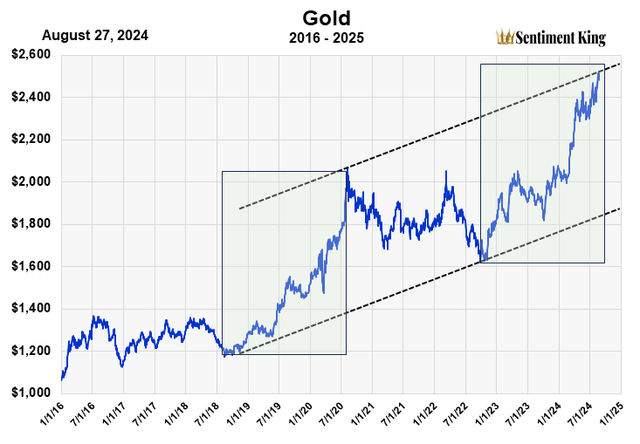
The chart below shows that gold has reached both the price and time targets we established.

The Long Term Chart of Gold Showing the Parallel Trend Channels and Equal Times of The Current Rally with the Previous Rally (The Sentiment King)
These trend channels were drawn last April and are why are we originally established $2,450 as a price target. The top trend channel was at $2,450 at the time. The top channel has risen over the last five months, allowing for a slightly higher price, which we've obviously achieved.
The two green boxes have equal time bases. They show that the current rally, which began in 2022, has now lasted about the same length of time (two years) as the previous rally from 2018 to 2020.
From a technical standpoint, the current two-year rally is now fully extended, and an intermediate term correction is warranted.
There is still too much "call" buying in GLD
The puts to calls ratio is a wonderful sentiment indicator for the stock market. It's well known that when "too many" investors expect prices to rise they generally decline and vice versa. This is very true of gold too. By comparing how much money is going into GLD "calls" versus GLD "puts", we gain insight into whether investors expect GLD to rise or fall.
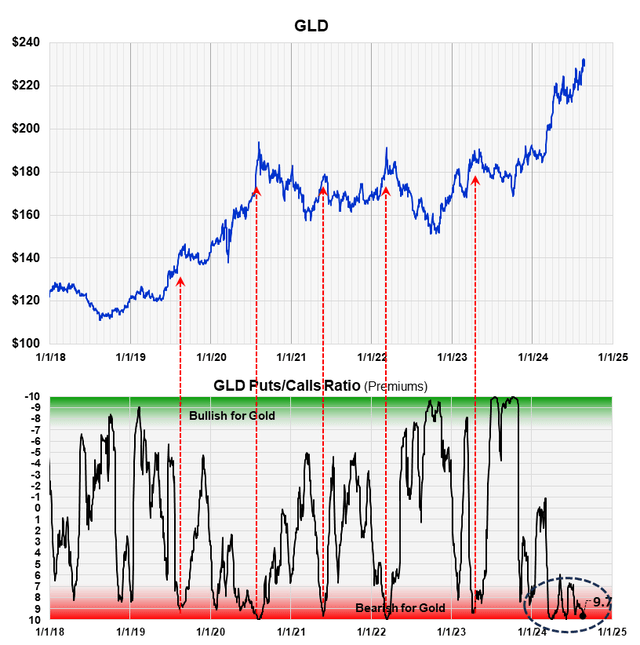
The indicator below compares how much money is going into directed puts versus directed calls in GLD. If a lot more money is going into GLD "calls" compared to GLD "puts", it means there is "too much" optimism and one can expect lower prices. We have that today, as this chart shows.

The Puts to Calls Ratio Of Money Going Into GLD Over Twenty Days Plotted On The Sentiment King Ranking Scale (The Sentiment King)
We've indicated with red arrows five times since 2018 when there was excessive optimism with large amounts of call buying. These extreme readings we call Red Zone readings.
As you can see, they almost always occurred at price peaks in gold. We have had almost continuous Red Zone readings since April, so excessive bullish optimism still exists for GLD. We think this is strong sentiment verification that the two-year rally in gold is coming to an end.
Gold Advisors and Newsletter Writers are Still Too Optimistic
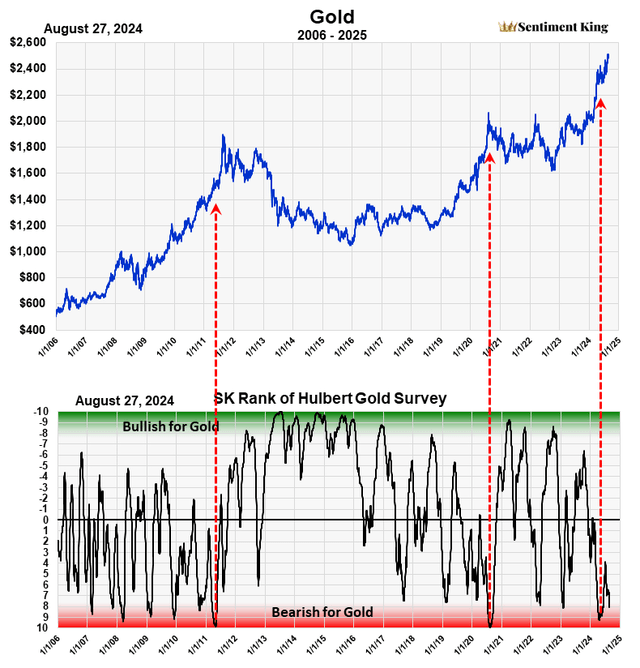
The chart below shows the Sentiment King ranking of the Hubert survey of gold advisors and newsletter writers. It goes back to 2006.

The Hulbert Survey Of Gold Newsletter Writers Put on the Sentiment King Ranking Scale. (The Sentiment King)
Like all surveys, it acts as a contrary opinion indicator. When too many advisors and writers are bullish on gold, prices are generally at a peak. We've indicated with Red Arrows three times in the last 20 years when we had this high level of bullish optimism regarding gold from the newsletter writers.
Two occurred and a major price top; the latest one occurred in April, and it is still extant today. Granted, there were a number of Red Zone readings in 2007 to 2009 that didn't become major declines, but they did occur at a short to intermediate term tops.
To us, this indicator also strongly suggests the current two-year bull market in gold is coming to an end.
Our Long-Term Gold Indicator Is Neutral
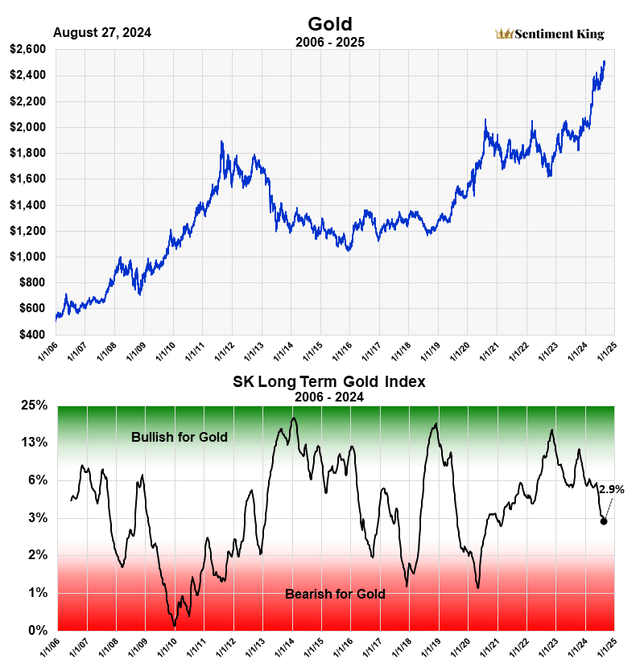
The SK gold buyer index, which is our long-term gold indicator, is made from commitment of traders' data in gold futures. We combine the amount of shorting by money managers of gold futures and compare it to how much the gold producers are buying.
The chart below shows this indicator back to 2006. Green zone readings represent long term bullish outlook, while red zone readings signal caution long term.

The Sentiment King Long-Term Buyer Index For Gold Futures (The Sentiment King)
You can see the two Green Zone buy signals that occurred in late 2022 and in October 2023. Well, we don't have a red zone cell signal in this long-term indicator it is moving in that direction, and we could reach that in the next three to six months. Until we do, we're going to maintain our long-term bullish stance with the idea that any correction will be intermediate-term, lasting from three to six months.
While the two earlier indicators in this article point to caution over the short to intermediate term, we're very encouraged that this indicator still shows the long-term trend is positive. We think holding a gold position of 50% of allocation is the correct recommendation in the face of these indicators and market conditions.
Disclaimer: Investing carries risk. This is not financial advice. The above content should not be regarded as an offer, recommendation, or solicitation on acquiring or disposing of any financial products, any associated discussions, comments, or posts by author or other users should not be considered as such either. It is solely for general information purpose only, which does not consider your own investment objectives, financial situations or needs. TTM assumes no responsibility or warranty for the accuracy and completeness of the information, investors should do their own research and may seek professional advice before investing.

