Options Play on US-listed China Stocks after Rate Cut
With eager anticipation, the Fed has kicked off its rate-cutting cycle, surprising the market by cutting rates by 50 basis points, lowering the federal funds rate to 4.75%-5%.
On September 19, U.S.-listed Chinese stocks soared, with the $NASDAQ Golden Dragon China Index(HXC)$ rising 4.15%.
$XPeng Inc.(XPEV)$ surged over 8%, $NIO Inc.(NIO)$ jumped over 7%, and $JD.com(JD)$ and $Bilibili Inc.(BILI)$ gained more than 6%.
$Tencent Music(TME)$ , $Alibaba(BABA)$ $Vipshop(VIPS)$ were up over 4%, while $iQiyi Inc.(IQ)$ $FULL TRUCK ALLIANC SPON ADS EACH REP 20 ORD SHS CL A(YMM)$ $NetEase(NTES)$ $Weibo(WB)$ rose over 3%. $Baidu(BIDU)$ $Li Auto(LI)$ $PDD Holdings Inc(PDD)$ also saw gains, with increases of over 2% and 1%, respectively.
This rally in Chinese stocks isn’t random, historical data shows that rate cuts benefit a range of Chinese assets.
Four Key Trends
Analyzing six rate-cut cycles since the 1990s reveals some trends:
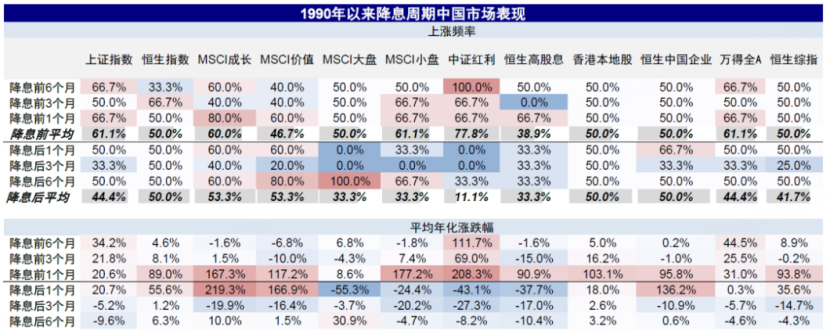
2. In the first month post-cut, growth stocks outperform value stocks, and small caps outperform large caps, but after 6 months, large caps catch up and value stocks have a higher win rate;
3.Except for essentials and energy, most A-share sectors decline post-cut, while most Hong Kong sectors rise, particularly Telecom (+11.5%) and IT (+10.1%);
4.Local Hong Kong stocks initially lag behind Chinese stocks after a cut but maintain positive returns, while the $HSCEI(HSCEI)$ turns negative after 3 months.
Given the anticipated performance of Chinese assets post-rate cut, investors can utilize options strategies in the U.S. market, such as $KraneShares CSI China Internet ETF(KWEB)$ , to capitalize on this trend. A bull call spread strategy may be a strong choice based on KWEB's historical performance.
What is a Bull Call Spread Strategy?
A Bull Call Spread strategy involves buying a call option with a lower strike price while simultaneously selling a call option with a higher strike price, both with the same expiration date.
Compared to simply buying a call, this approach generates extra premium income, reducing the net premium outlay and shifting the breakeven point to the left, which increases the probability of success. Essentially, it's a low-cost way to buy call options.
This strategy is ideal for investors who believe the underlying asset will rise moderately but not dramatically. It works best in a market with low expected volatility, allowing profits through reduced option costs.
KWEB Bull Call Spread Example
KWEB is currently priced at $26.96. An investor can:
Step 1: Buy a call option with a strike price of $27, expiring on October 18, for a cost of $81.
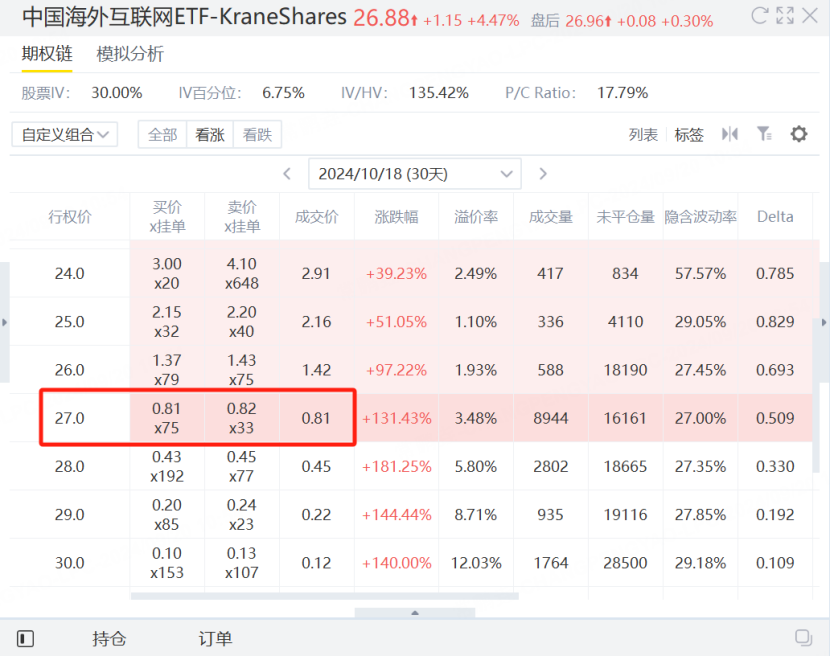
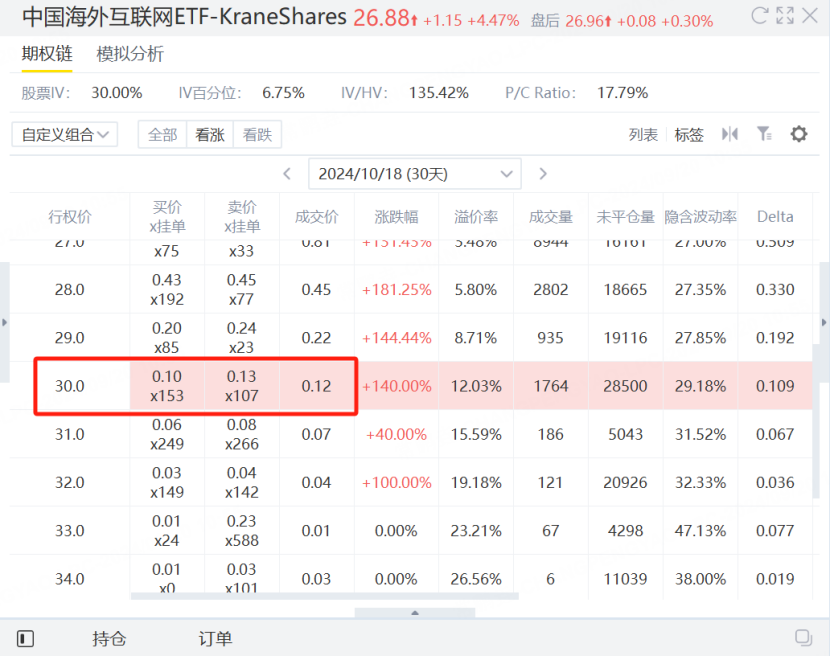
1.Cost Breakdown
- Cost of buying the $27 call: $81
- Premium from selling the $30 call: $12
- Net cost: $81 - $12 = $69
2.Profit and Loss Scenario
- Maximum Profit: When the asset price is at or above $30 at expiration. The maximum profit comes from the difference in strike prices, which is $3 (30 - 27). Since each option contract represents 100 shares, the total profit would be $3 × 100 = $300. Thus, the maximum profit = $300 - $69 = $231.
- Maximum Loss: This equals the net cost, as the investor won't exercise the $27 call if KWEB's price is below $27 at expiration. So, the maximum loss = $69.
- Breakeven Point: The breakeven occurs when the asset price equals the strike price plus the net cost. Breakeven = $27 + ($69 / 100) = $27.69.
This strategy helps investors capitalize on moderate price increases while limiting risk.
Disclaimer: Investing carries risk. This is not financial advice. The above content should not be regarded as an offer, recommendation, or solicitation on acquiring or disposing of any financial products, any associated discussions, comments, or posts by author or other users should not be considered as such either. It is solely for general information purpose only, which does not consider your own investment objectives, financial situations or needs. TTM assumes no responsibility or warranty for the accuracy and completeness of the information, investors should do their own research and may seek professional advice before investing.
