Options are ALWAYS about vol
Lots of fun stuff to learn today about options. Jumping right in.
GLD and USO
On the weekend of August 18th I pointed out that GLD ATM vol looked expensive as of the close on August 16th. I wrote about the setup and the performance after a week in the following posts respectively:
Flash post on GLD vol (8/8/24)
how many coin flips until your goal? (8/25/24)
I did not put anything on myself as I prefer to stick to trades where my vol lens and directional bias overlap. I have no opinion on gold. It’s a small part of my overall asset allocation as is other crap I don’t understand like BTC and ETH. If my well-being in life ever relies on me spending lots of attention on these things please shoot me. Otherwise they are just part of the diversification pupu platter and will be rebalanced if they become big and if they don’t it’s because the lights went out, and “B”, “T”, “C” are last seen scrawled on a cave wall while some hairy girls and boys try to repopulate our grey planet.
Then on September 11th (that date always feel heavy) I got bullish oil and bearish its vol which looked high. I explain the trade I did in:
commodity kamikaze (9/11/24)
You don’t need to go back to read any of those posts. The quick version is I liked
- selling GLD Nov 232 calls (those were at-the-money at the time) and delta-hedging to isolate the vol
- selling USO October 67 puts (they were about .45 delta, slightly OTM) outright with no hedge because I was bullish and thought the vol was high
In hindsight, both of these trades yield fantastic examples about the nature of option trading. We’ll take each in term and then summarize what we learned. I did the analysis over the weekend so the data runs through Friday, October 11th. I also run the analysis from the perspective of an option buyer but I’ll remind you to just flip it to think of it from the seller’s view.
GLD
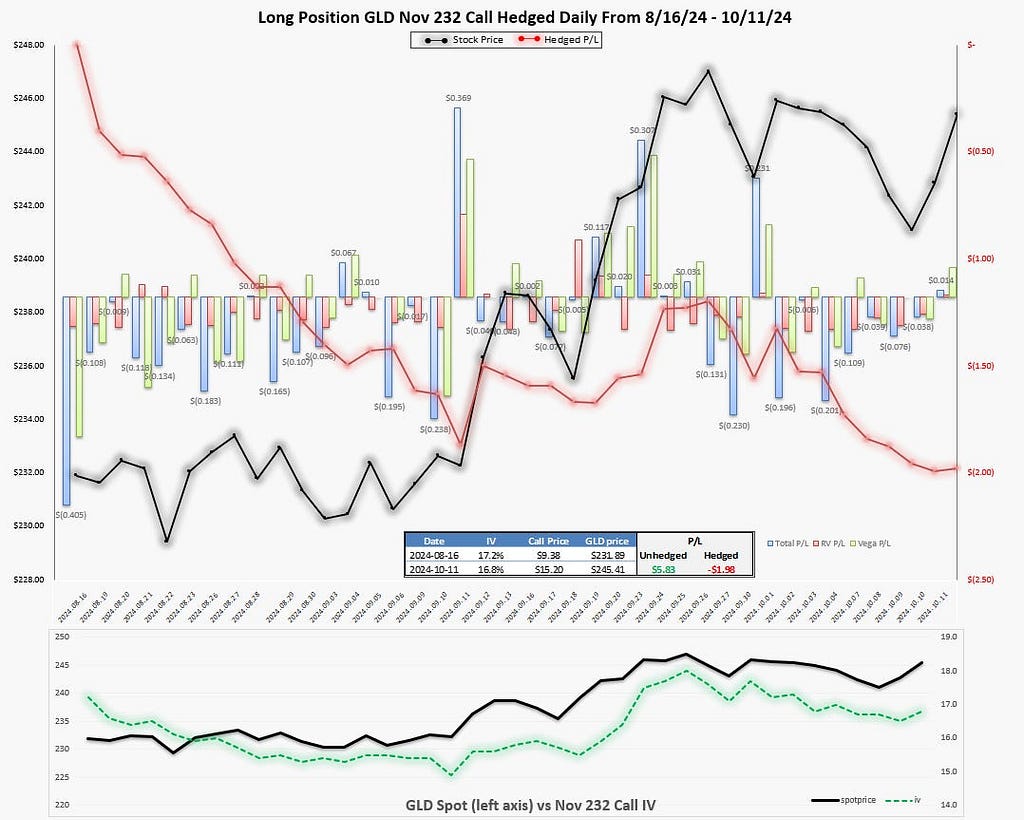
From 8/16 to 10/11:
- GLD rallied over $13.50 or 5.7% from $231.89 to $245.41
- The Nov 232 call went from being ATM to far ITM. The call went from $9.38 to $15.20, more than a 50% return.
- The implied vol (IV) of the 232 call went from 17.2% to 16.8%
Realized vol computations for 40 days:
Standard dev of logreturns sampled daily = .76%
- Annualizing: .76% * √251 = 12%
Point-to-point return over 40 days = 5,7%
- Annualizing: 5.7% * √(251/40) = 14.2%
Synopsis:
- If you bought the call outright and held it for 40 days you were up 50%.
- If you bought the call and delta-hedged daily, you would have lost 20%
It’s possible for both the option buyer to win (they got paid for delta risk) and for an option seller who delta-hedged to win (they got paid for volatility risk)!
[This appears to fly in the face of zero-sumness of options but zero-sumness holds at the aggregate level — the vol trader’s distributed counterparties who sold stock to the hedge trades “lost”]
Notable quantities in the picture:
The hedged p/l is cumulative sum of daily p/ls referred to as Total P/L.
The Total P/L is mostly comprised of:
- RV or realized p/l = gamma p/l + theta p/l
- Vega p/l = p/l resulting from the IV on the strike changing day-to-day
- You’d need to squint but vega and realized p/ls don’t sum exactly to the total. That’s because option p/l has sensitivity to higher order greeks (for example your vega and gamma are not constant as the stock price changes but our attribution acts as if they are from snapshot to snapshot). Unless you are trading tons of contracts as a professional vol trader, my recommendation is to only attribute vega and realized because they are highly informative and will make up more than 2/3 of the attribution easily. I would generally group the higher order greek p/ls into a single error term and call it “unexplained p/l”. It’s how we did it almost 25 years ago and it’s still the way to go for anyone who isn’t crazy enough to have an opinion on a 23 delta option vs a 24 delta option.
You’ll notice that the vol got hammered from the moment I called it expensive and took a month to have a meaningful uptick again (the IV actually went down 16 out of 18 days before popping when the stock spiked on 9/12). All the delta-neutral p/l was made in that first month.
[Remember the chart assumes you bought the vol, but we are talking from the seller’s POV.]
In the second month, the delta neutral p/l is fairly flat but has had a wild path.
Let’s switch gears.
USO
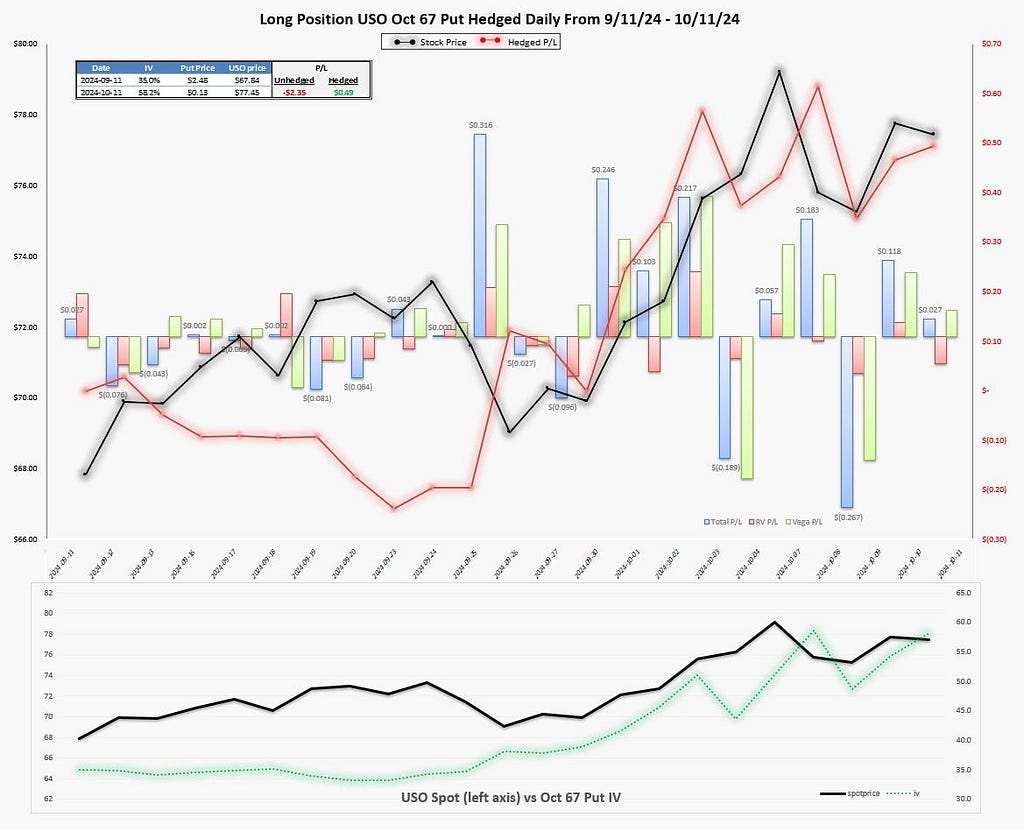
From 9/11 to 10/11:
- USO rallied over $9.50 or 13.2% from $67.84 to $77.45
- The Oct 67 put went from being nearly ATM to far OTM. The put went from $2.48 to $.13, losing 95% of its value
- The implied vol (IV) of the 67 put went from 35% to 58%
Realized vol computations for 22 days:
Standard dev of logreturns sampled daily = 2.3%
- Annualizing: 2.3% * √251 = 36.5%
Point-to-point return over 22 days = 13.2%
- Annualizing: 13.2% * √(251/22) = 44.7%
Synopsis:
- If you bought the put outright and held it for 22 days you lost almost all your premium.
- If you bought the put and delta-hedged daily, you would have made 25%
Note this is the opposite of the GLD situation where the direction is now wrong but it was a good vol to buy.
Evaluate your directional bets and vol bets separately!
I happened to sell USO puts outright because I was bullish, but it was a terrible vol trade. It started off well but the war stress changed the market. It’s reasonable to question myself — the typical tools I use to evaluate vol said it was expensive but the market may very well have understood the probability of the war escalating.
But I think this harsh self-evaluation might also be a bit too much Monday morning quarterbacking. USO stock rallied 8% before the vol trade finally upticked against me. If anything, it felt like I got it right — right to sell vol and right to be bullish. On 9/26, the vol ripped and it was noteworthy because it did so on a down move in the stock! Not what you expect if war tension was driving the vol.
[ 👽This is subtle if you aren’t a vol trader: if the stock surged again and the strike vol increased it might not have meant much because at that point the strike is sliding up the skew curve as it gets further OTM. So sure the vol might be going higher but the delta and vega of the option are evaporating]
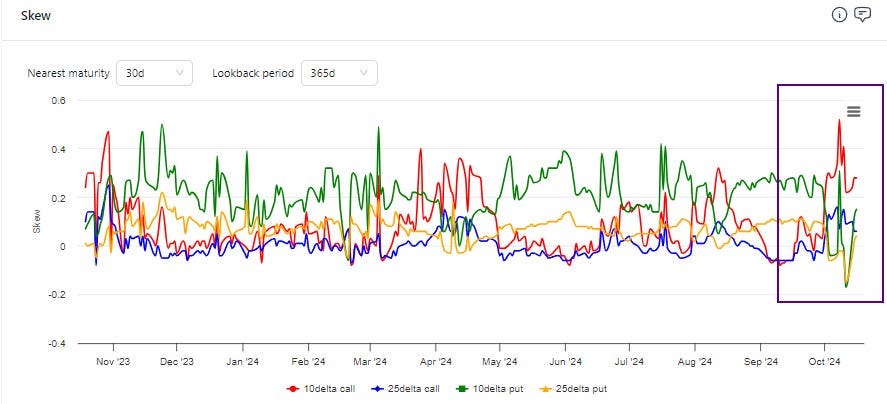
Time for the visual:
If I can get you to take one thing away from today’s post it’s:
Be clear about why you are expressing a trade via options. If it’s just direction with no thought of the vol you might win anyway. Just like someone won buying the expensive GLD call despite being wrong on vol. But if you are wrong half the time, your directional edge is a wash and you just end up paying large volatility vigs. In the GLD case, a bullish investor could have seen the opportunity to buy the stock and sell covered calls or to sell puts outright instead.
To be repetitive:
- Directional traders think an underlying is mispriced but assume the options are fair
- A vol trader has a view on the options but assumes the underlying is fair
My directional trading is pretty vibey (you’ve seen my GME, IWM, USO, going back to last year, XHB, trades in real-time — they’re vibey. I might be running the table on these but I also sold my home during Covid. On a dollar-weighted basis I’m, well, unhoused actually says it all doesn’t it. I see any victories as the god of markets just forgiving my rent when I land on Illinois Ave because it’s prefers to bury me on Boardwalk). But if I express the trade with options I go through the progression like a QB goes thru his reads. There’s a little bit of vibey stuff in that too, maybe like how an experienced QB can feel the pressure or knows when to step up in the pocket. But at least with options I can articulate even those vibey parts better than I can with the directional stuff.
Reminder on good trading decision hygiene
Be careful with the “resulting” thing. The path of least resistance it to remember your good trades and ignore your bad ones. You have to actively push back against this need for comfort and soothing.
If you don’t properly attribute what went well, what went wrong, and WHY then you can’t improve.
This is kindergarten-dumb but you can just report card yourself with crayons like this:
The symbol should appear in each row 1x
Obviously all of this can be seen as a pitch for checking out moontower.ai, but to be clear about the causation, we built it because the vol lens is the right way to approach options as opposed to me making up examples to say this is why people trading options should look at the software I’m hawking.
The software’s raisin d’etre is to give me my goggles back. I’m not touching options without looking at what is priced into them.
Ultimately, I hope this small case study helps you understand options better and if you are interested in developing a vol lens you know where to go.
The “act of god” clause in options: Path
I beat the same drum repeatedly — options are always about volatility. Most option users are trading calls and puts for directional reasons. That’s more than fine, it can be great. But how great of an idea it is, depends on how tight your thesis for the directional bias. The more specific you are about the probabilities, payoffs, and timing of your thesis the more options make sense.
Options are priced for specificity based on a volatility and time to expiry.
[Since a standard deviation is a function of both of these inputs, at pretty basic level they are congruent concepts]
There’s tremendous leverage in disagreeing with the way they are priced because if you are better at handicapping the outcome, the option is likely mispriced and possibly by a lot.
[Of course “better at handicapping the outcome” is compressing a lot of labor into 5 easy-to-write words. If you can shoot 50% from beyond the arc you can play in the NBA. It was so easy to write that sentence too.]
If you have specific views about probability and payoff, you already have a view on volatility! You might not think in those terms or be fluent in its language but you ARE thinking with a volatility perspective. Just because you can’t think in Spanish doesn’t mean you can’t think. You need a translator (I think the appeal of this letter to investors who don’t come from options — at its core it’s about translating ideas to a volatility lens. An example from a DJT bit on Twitter.)
In the journey of learning options the first major breakthrough is realizing that options are always about volatility.
A breakthrough that happens later, if at all, is the recognition that vanilla options despite their “vanilla-ness” can be quite diabolical because even though they are about volatility, that truth can be undermined by “the act of god” in investing → path.
There’s no predicting path but it has a tyrannical impact on option payoffs even AFTER accounting for volatility.
I showed this with a simple coin flipping simulation in a post whose title sums up how much noise there is in option p/l performance:
👻Short Where She Lands, Long Where She Ain’t
It’s an idea that is very hard to grok without a lot of live trials.
Update late on the evening of 10/16 before I head to bed…
I posted this in the moontower.ai community:
Got my eye on oil…USO has retraced downward again to about 5% above where I was a buyer back on my note on 9/11
The put skew has firmed, the vols have eased off the highs but being priced as high as the realized vol has been all through the chaos of the last month
I’ve got my eye on selling puts again.
Last time I sold them outright and then after the market rallied about 10% i sold futures to monetize (rather than buy the puts back). now i’d be looking to get long delta again via put selling
(separately I did a post-mortem on my oil trade in today’s letter. it was a bad vol trade but a good directional trade)
The remainder of this post is a follow-up that decomposes the lingering path vs volatility conflation that blocks our understanding that even delta-hedged options are slaves to where the stock expires.
To demonstrate how sensitive delta-hedged option performance is to the terminal price (even after accounting for volatility), I use the same Monte Carlo engine I laid out in…(subscribers can continue at moontower.substack)
If you are trading options or using them in your investment process you should def check out the moontower.ai option trading analytics platform
Disclaimer: Investing carries risk. This is not financial advice. The above content should not be regarded as an offer, recommendation, or solicitation on acquiring or disposing of any financial products, any associated discussions, comments, or posts by author or other users should not be considered as such either. It is solely for general information purpose only, which does not consider your own investment objectives, financial situations or needs. TTM assumes no responsibility or warranty for the accuracy and completeness of the information, investors should do their own research and may seek professional advice before investing.


