Initial Report(Part1): TSMC (TWSE:2330), 70% 5-Year Potential Upside (VIP, Fabian VERA)
Valuation
Taiwan Semiconductor Manufacturing (TSMC) currently trades at ~FY2024 28.59x P/E, which is below to both the current industry average of 65x and the three-year industry average of 34.8x.
Given that TSMC current valuation is below average in the cyclical industry of semiconductor foundry, a fair assessment would lead to an IRR of 2-11%, and by the compounding effect of time, leading to a three-year target price of NT$976.72 and a five-year target price of NT$1,591.31.
As these high-floor prices are most likely to materialize due to Artificial Intelligence adoption and smartphone infiltration in society, it is right and just to dive into this rising tide that lifts all those technology boats.
Company overview
Established in 1987, TSMC was the world’s first dedicated semiconductor foundry. It was created to meet the growing demand for integrated circuits and to offer manufacturing services to other companies that design semiconductors but do not have their own fabrication facilities.
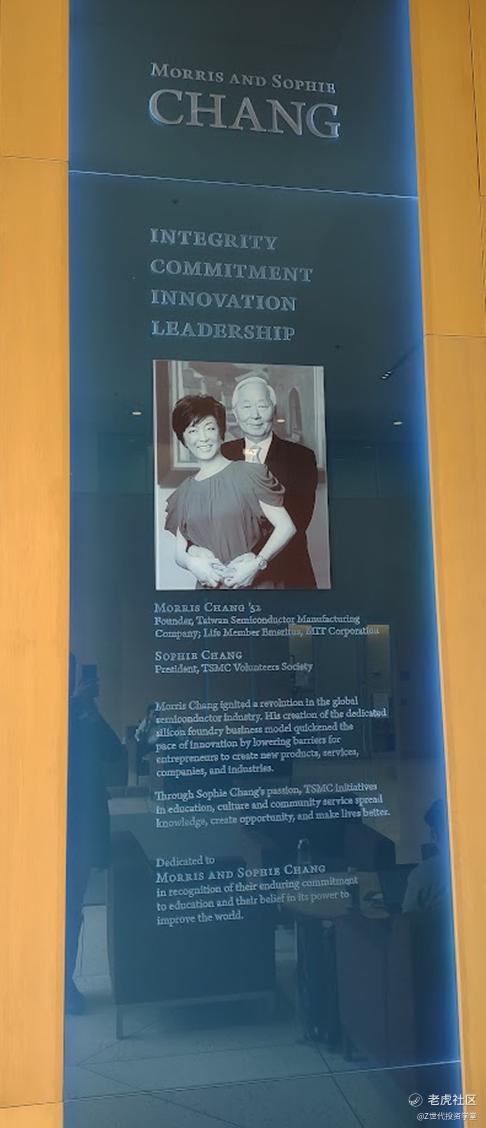
With Morris Chang at the helm as founder, TSMC grew rapidly and became a significant player in the global semiconductor market, which now operates a network of fabrication plants or foundries in Taiwan and has expanded its presence in the United States, China, Germany, and Japan. The company's headquarters and most of its R&D operations are based in Hsinchu, Taiwan. So much is the impact of this endeavor that you can find both Morris and his wife Sophie at the entry hall of MIT Sloan School of Management in Cambridge, Massachusetts, USA.
Fig. 1 – Picture of Morris and Sophie Chang at the entrance hall of MIT Sloan School of Management in Cambridge, Massachusetts, USA.
Industry Landscape
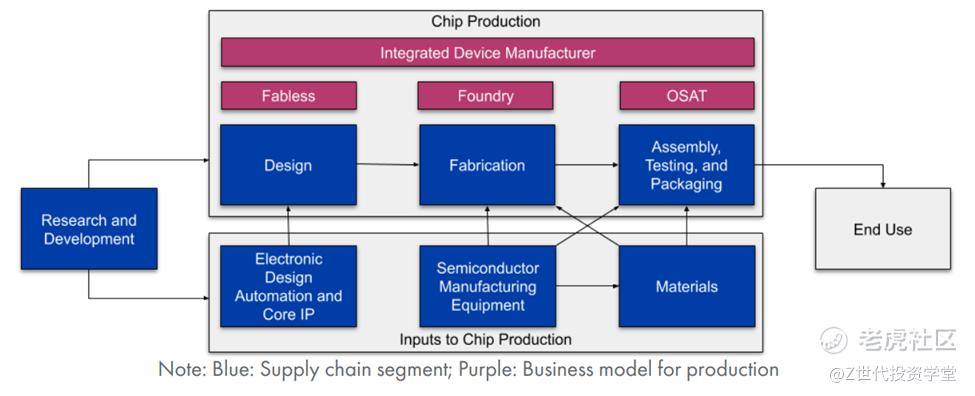
The semiconductor foundry industry plays a crucial role in the global technology supply chain, providing manufacturing services for semiconductor companies that design chips but do not have their own fabrication facilities.
Fig. 2 – Semiconductor Supply Chain, Center for Security and Emerging Technology, 2021 [1]
TSMC is the largest and most advanced semiconductor foundry in the world, commanding over 50% of the market share. Known for its cutting-edge technology, TSMC leads in advanced process nodes (e.g., 5nm, 7nm) and is a key supplier for major tech companies like Apple, AMD, and Nvidia.
By daring to sound too technical, I will defer engineering details of manufacturing process to the sterling study of Shan et al [1] available at the end of this memo. Meanwhile, Fig. 3 illustrates how the chips that powers your laptop, your phone, and chances are your favorite AI, come from nodes and wafers.
Fig. 3 – Chip Manufacturing Process, Center for Security and Emerging Technology, 2021 [1]
Framework to Analyze Semiconductor Foundries
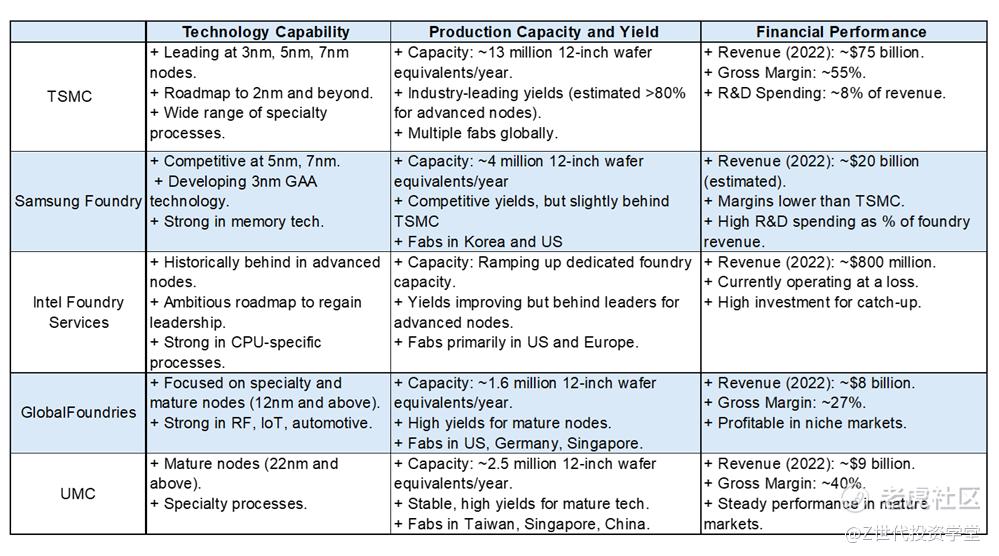
To analyze Semiconductor Foundries effectively, three crucial variables should be considered: technological capability, production capacity and yield, and financial performance.
Technological capability.- Involves evaluating the range and advancement of process nodes, such as 3nm and 5nm, and the adoption of cutting-edge technologies like Extreme Ultraviolet (EUV) lithography. This also includes assessing the level of R&D investment to maintain technological leadership and reviewing the fab’s technology roadmap for future development.
Production capacity and yield.- Key for understanding a fab’s efficiency and scale with important metrics like wafer starts per month, which measure production scale, and the fab utilization rate, which indicates capacity usage. In addition, manufacturing yield rates defined as the percentage of functional chips per wafer, are crucial as higher yields translate into more efficient production processes and better overall efficiency.
Financial performance.- it provides insight into a fab’s economic stability and growth potential in the shape of revenue growth, profit margins, and focusing on contributions from different technology nodes. In particular, assessing the return on investment (ROI) for recent capital investments in new foundries or upgrades as well as evaluating the cost structure, including capital expenditures, operating expenses, and cost per wafer to determine financial health and competitiveness.
Using these three variables, Table 1 gathers both TSMC and its closest competitors, which leads us to our next section under the label of competitor analysis.
Table 1.- TSMC and close competitors under the aforementioned framework.
Competitor Analysis
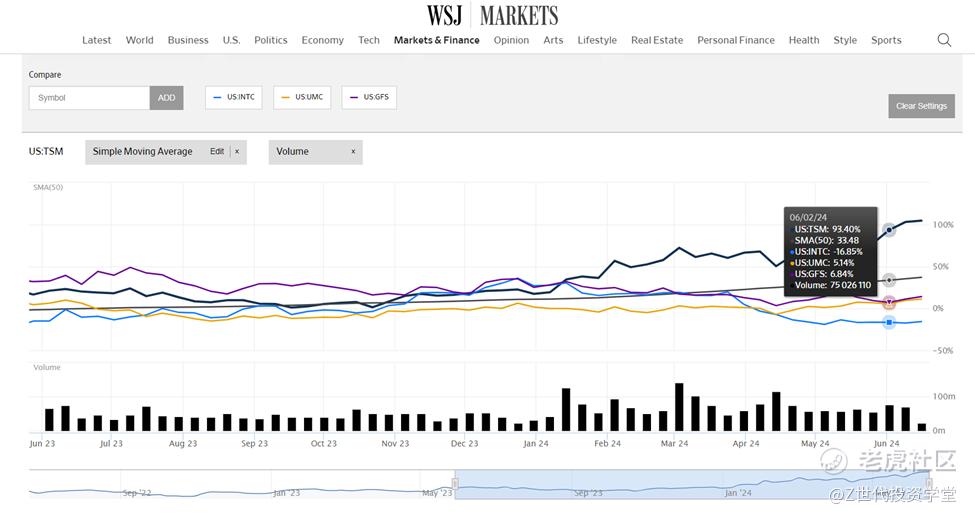
Fig. 4 – Multiple Valuation plot of TSMC and its competitors, accompanied by stock performance.
The correlations suggest that industry-wide factors affect all players as the magnitude of growth varies significantly, with TSMC showing the most dramatic increase whereas Intel shows a notable recovery trend, possibly reflecting market optimism about its efforts to regain technological competitiveness, and both UMC and GlobalFoundries show more modest growth, reflecting their different market positions and focus areas compared to TSMC.
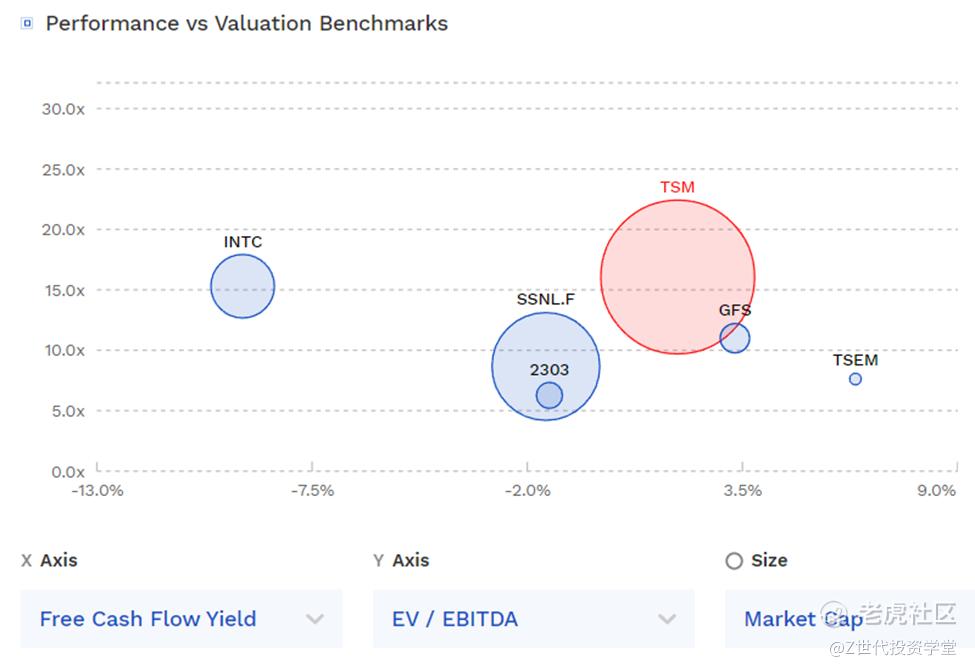
The lower part of Fig. 4 offers generate some observation points about TSMC-specific strengths and strategies that lead to significant differences in stock performance.
+Market Cap (Size of the circles): TSMC has the largest market capitalization among the companies shown, indicating that it's the most valuable company in this group.
+EV/EBITDA (Y-axis): TSMC has a higher EV/EBITDA multiple compared to most of its competitors. This suggests that investors are willing to pay a premium for TSMC's earnings, likely due to its market leadership and growth prospects.
+Free Cash Flow Yield (X-axis): TSMC's position shows a positive free cash flow yield, while some competitors like INTC (Intel) have negative yields. This indicates TSMC's strong cash generation ability relative to its market value.
+Positioning: TSMC is positioned in the upper right quadrant of the chart, which typically represents a favorable combination of growth (higher EV/EBITDA) and value (positive free cash flow yield).
+Competitors: Figure 4 includes other major players in the semiconductor industry:
-
INTC (Intel): Struggling with negative free cash flow yield
-
GFS (GlobalFoundries): Positioned close to TSMC but with lower multiples
-
SSNLF (Samsung): Lower EV/EBITDA multiple than TSMC
-
TSEM (Tower Semiconductor): Much smaller market cap and lower multiples
TSMC's position suggests it's "eating their lunch" by outperforming its competitors in terms of market valuation, cash flow generation, and overall financial health, which aligns with TSMC's known market leadership in advanced semiconductor manufacturing processes.
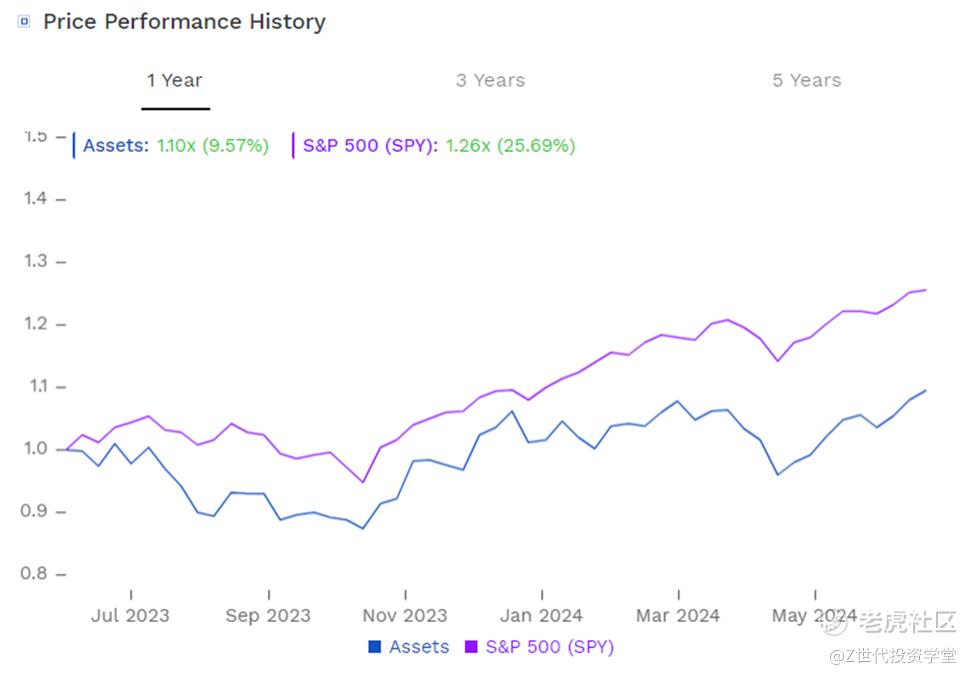
An accessory of this analysis would be to create a basket of tech stocks to see how well this competition performs against the S&P. On Figure 5 we see that such selection underperforms the benchmark by 16.12% which is a lot given that many funds pay bonuses when a portfolio beats a 15% hurdle rate.
Fig. 5 – Basket of TSCM and its competitors versus the S&P benchmark.
*Do note that all of this is for information only and should not be taken as investment advice. If you should choose to invest in any of the stocks, you do so at your own risk.
Modify on 2024-11-18 16:11
Disclaimer: Investing carries risk. This is not financial advice. The above content should not be regarded as an offer, recommendation, or solicitation on acquiring or disposing of any financial products, any associated discussions, comments, or posts by author or other users should not be considered as such either. It is solely for general information purpose only, which does not consider your own investment objectives, financial situations or needs. TTM assumes no responsibility or warranty for the accuracy and completeness of the information, investors should do their own research and may seek professional advice before investing.


