CRCL Volatility Soars: Which Options Strategies Deserve Attention?
What Does an Implied Volatility of 150% for CRCL Mean?
The recent U.S. IPO market has been red-hot, and Circle Internet Corp. (CRCL) has captured widespread attention. In just a few weeks, its stock price surged from $31 to nearly $300 at its peak, representing a cumulative gain of over 860% since listing, with a market cap briefly reaching $65 billion.
As CRCL experienced extreme price swings, its implied volatility (IV) also skyrocketed. Implied volatility reflects the market’s forecast of how much the underlying asset will fluctuate in the future, and is usually expressed as an annualized percentage.
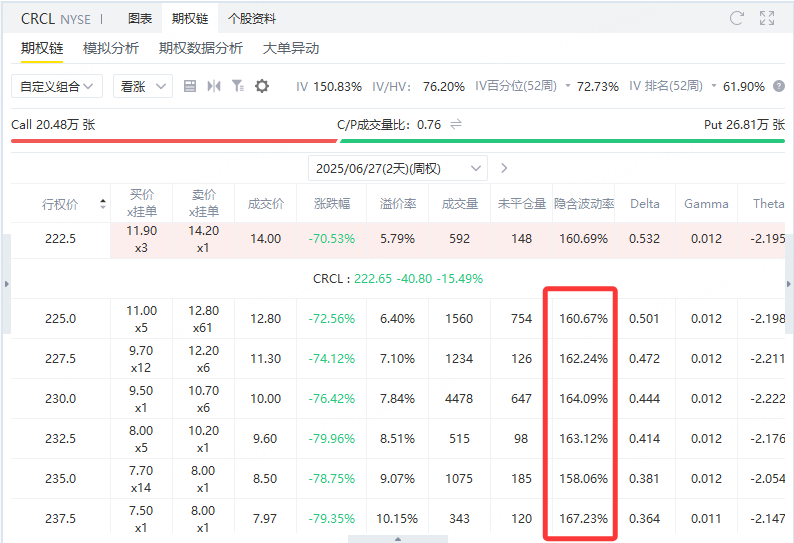
With CRCL currently trading at $222, an implied volatility of 150% suggests:
The market expects CRCL’s price to fluctuate within a ±150% range over the next year.
Statistically speaking:
Assuming a normal distribution, there's a 68% probability the stock will trade between:
Upper bound: $222 × (1 + 1.5) ≈ $555
Lower bound: $222 × (1 − 1.5) ≈ negative value (i.e., theoretical bankruptcy)
In essence: The market is expecting extreme future volatility, but not predicting a specific direction.
Why is CRCL's IV so high?
CRCL is a newly-listed, high-profile stock with uncertain fundamentals and regulatory outlook.
The stablecoin sector is policy-sensitive—any disruption to USDC could cause violent price swings.
Investors are highly divided: some believe CRCL is the next PayPal, others see it as a speculative bubble.
A surge in speculative capital has driven up options demand, thereby inflating IV.
High IV Creates Strategic Opportunities
When implied volatility is elevated, option prices become expensive. This favors option-selling strategies that profit from volatility compression and time decay.
Below are several key strategies for shorting volatility in a high-IV environment:
🔹 Vertical Spread
A vertical spread involves buying and selling options with the same expiration date but different strike prices. Common volatility-shorting versions include credit spreads, such as:
Bear Call Spread: Sell lower strike call, buy higher strike call
Bull Put Spread: Sell higher strike put, buy lower strike put
These structures profit if the underlying price stays within a certain range or moves modestly in the expected direction.
Market context:
High IV inflates option premiums. Selling options in this environment allows investors to collect generous credit. These strategies are best used when expecting the stock to remain range-bound or move modestly.
Advantages:
Risk-defined, premium-rich: Max gain and loss are predefined.
Less risky than naked option selling due to the built-in hedge.
Profits from time decay (Theta) and IV contraction.
Disadvantages:
Limited profit: Gains are capped, even if the underlying moves favorably.
Still exposed to directional risk: A strong move beyond the strike range can lead to full loss.
If IV increases further, the position may lose value.
Timeframe:
Best suited for short to medium-term trades (a few days to weeks), where near-term options decay quickly and IV may mean-revert.
🔹 Calendar Spread
A calendar spread uses options with the same strike but different expiration dates. Typically, one sells a near-term option and buys a longer-term option (either calls or puts).
Market context:
Traditional calendar spreads are more effective when IV is low at entry. The idea is to benefit from time value differential and potential IV increase in the longer-dated option.
Advantages:
Gains from both time decay of the short leg and IV increase of the long leg.
Long-dated options are more sensitive to IV (positive Vega), giving upside if volatility rises.
Disadvantages:
In a high IV environment, long-dated options are expensive. If volatility falls, the value of the long leg can drop faster than the short leg gains, leading to loss.
Reverse calendars (sell long-dated, buy short-dated) can profit from IV falling but carry higher risk.
Timeframe:
Best for medium-term setups. Over just a few days, time decay is insufficient to generate profit; longer durations allow the spread’s dynamics to play out. However, in high IV conditions, traditional calendar spreads are vulnerable to IV collapse.
🔹 Short Put
A short put is a classic moderately bullish strategy. The trader collects premium by taking on the obligation to buy the underlying asset at the strike price if assigned.
Market context:
When panic is peaking, and volatility is near a top, selling puts can be a powerful way to monetize excessive fear. If the stock appears to be stabilizing, selling puts allows the trader to collect inflated premiums without expecting major downside.
Advantages:
Defined maximum profit: Equal to the premium received.
High probability of success if the stock stays flat or rises.
Negative Vega: Benefits from volatility falling.
Disadvantages:
Downside risk: If the stock collapses, the trader may be forced to buy at an above-market price, resulting in a loss.
Requires risk management and selection of appropriate strike levels.
Timeframe:
Effective over short to medium-term durations. In the short run, time decay accelerates, and volatility often cools. Over longer timeframes, position management becomes more critical.
🔹 Short Straddle
A short straddle involves selling both a call and a put option with the same strike price and expiration date, usually at-the-money (ATM).
Strategic objective:
Profit from lack of directional movement, time decay, and volatility contraction.
Selling a straddle is a pure short-volatility trade. When IV is high:
Option prices are inflated.
Sellers can collect large premiums.
If realized volatility is lower than expected, the straddle will decay in value, benefiting the seller.
Profit mechanics:
Maximum profit: Total premium collected, realized if the stock expires exactly at the strike price.
Maximum loss: Unlimited, if the stock moves sharply in either direction.
Breakeven range: Strike price ± total premium received.
Risk profile:
High potential reward, but unlimited risk in both directions. Requires margin and careful management.
Disclaimer: Investing carries risk. This is not financial advice. The above content should not be regarded as an offer, recommendation, or solicitation on acquiring or disposing of any financial products, any associated discussions, comments, or posts by author or other users should not be considered as such either. It is solely for general information purpose only, which does not consider your own investment objectives, financial situations or needs. TTM assumes no responsibility or warranty for the accuracy and completeness of the information, investors should do their own research and may seek professional advice before investing.
- Porter Harry·2025-06-25TOPThanks for sharing this detailed analysis! 🙏 With CRCL surging ~700% since its June IPO and pulling back ~15%, your volatility insights are spot on. Considering regulatory headwinds from BIS and mixed analyst views, I’d love your take: are you eyeing support near $200 for a re-entry or preparing for further shakeouts? 📉LikeReport