U.S. stocks are "too optimistic", how to play the leading hedging strategy?
According to the latest report data from Goldman Sachs, after a 32% surge in 2024, related stocks driven by AI have risen another 17% so far in 2025. With such a rapid rise, the expected P/E of the S&P 500 index has reached 22 times, which is at the highest level of the 96th percentile in history.
However, Goldman Sachs gave a relatively moderate answer after in-depth analysis:Optimistic, but not to the point of irrationality.
The report pointed out that the long-term earnings growth expectation implied by the current market price is about 10%, which is only slightly higher than the historical average of 9%, but far lower than the 16% during the tech bubble in 2000 and the market high in 2021. 13%.
Even the brightest "star stocks" in the market-large technology stocks-have relatively restrained valuations. According to the report data, the current top five technology giants by market capitalization ($英伟达 (NVDA.US)$、$微软 (MSFT.US)$、$苹果 (AAPL.US)$、$谷歌-C (GOOG.US)$、$亚马逊 (AMZN.US)$) 's average expected P/E is 28 times, significantly lower than the peak of 40 times in 2021 and 50 times during the tech bubble. Goldman Sachs believes that compared with the two big tops in history, although the current valuation is expensive, it still leaves a distance.
The fuel for this carnival comes from hundreds of billions of dollars in capital expenditures of large cloud service providers such as Amazon, Google, Meta, and Microsoft.The Goldman Sachs report cited data showing that the market's forecast for the total capital expenditure of these giants in 2025 has been raised by US $100 billion this year alone, reaching US $368 billion。
This huge investment directly translates into orders and profits for infrastructure suppliers such as semiconductors, power equipment, and technology hardware, sending their stock prices soaring.
However, there are also risks hidden beneath the feast.Goldman Sachs warned that the high growth in capital spending "inevitably slows", which poses risks to the valuation of "Phase 2" stocks. At present, the stock price increase of these companies has far exceeded the growth trajectory of their recent earnings, reflecting the market's extremely optimistic expectations for their future growth.
Key risk: Capex slowdown may trigger a 15-20% pullback
Goldman Sachs clearly pointed out the core weakness of current AI transactions: dependence on capital expenditures of technology giants. Analysts generally predict that capital expenditure growth will decelerate significantly in the fourth quarter of 2025 and 2026. Once the inflection point of growth rate appears, it may put pressure on the valuation of related stocks.
While predicting the timing of this inflection point is extremely challenging-as the market consensus has repeatedly underestimated the size of investment by tech giants-this trend of deceleration is "inevitable."
The line builds aExtreme stress test scenario: If the tech giant's capital spending suddenly pulls back to 2022 levels,That would reduce the S&P 500's expected sales growth in 2026 by about 30%.
The report's macro valuation model shows that this impact will not only directly hit short-term revenue, but also seriously damage the market's confidence in long-term AI-driven profit growth.It could ultimately lead to a 15% to 20% reduction in the valuation multiple of the S&P 500.
What exactly is the collar strategy?
To protect the downside risk of stocks, there is a strategy of buying put options (Protective Put), and to reduce the cost of holding stocks, you can sell Covered Call options (Covered Call). In order to take care of both, Collar options-this new strategy was born.
The operation method of collar option is to buy an out-of-the-money put option as insurance on the premise of holding stocks, and at the same time sell an out-of-the-money call option to pay the cost of insurance. This is equivalent to putting a Collar on the stock, and the income of the stock is locked in it, hence the name of the Collar option. The collar option is in fact a combination of Protective Put and Covered Call, which limits the risk of downside at the expense of removing some of the possibility of upside profit.
Collar options are available when traders have a bullish position in the underlying market and want to protect the position from market downside shocks. When the full cost of a put option is covered by selling a call option, it is called a zero-cost collar strategy.
Nvidia Collar Options Strategy Case
Let's say an investor owns 100 shares now at $167$Nvidia (NVDA) $, investors are not sure how prices will change in the near future and want to buy an insurance policy for their positions. You can use the collar strategy.
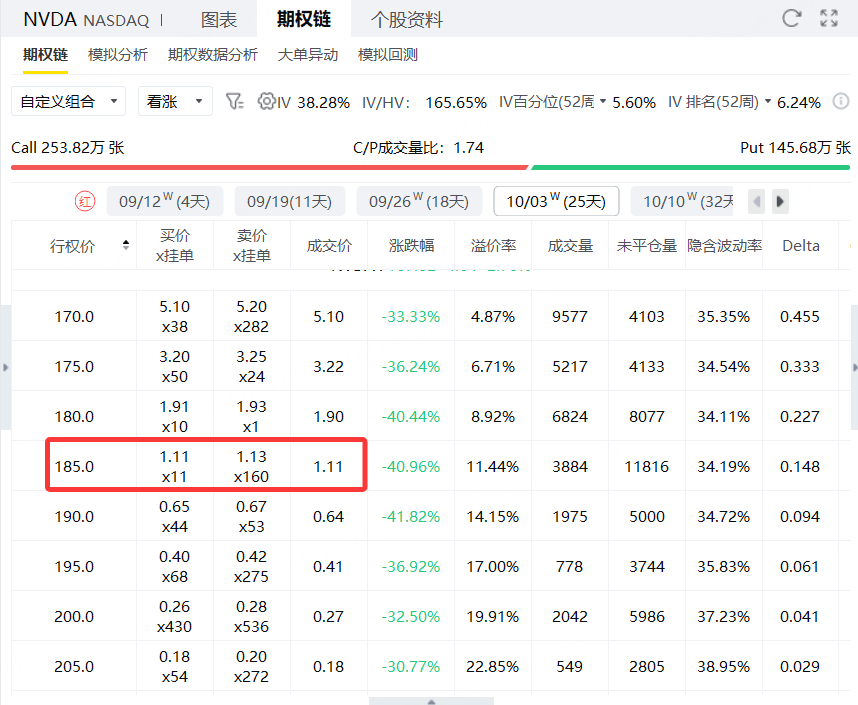
In the first step, investors can sell a call option with an exercise price of $185 and an expiration date of October 03 at a price of $1.11, earning $111.
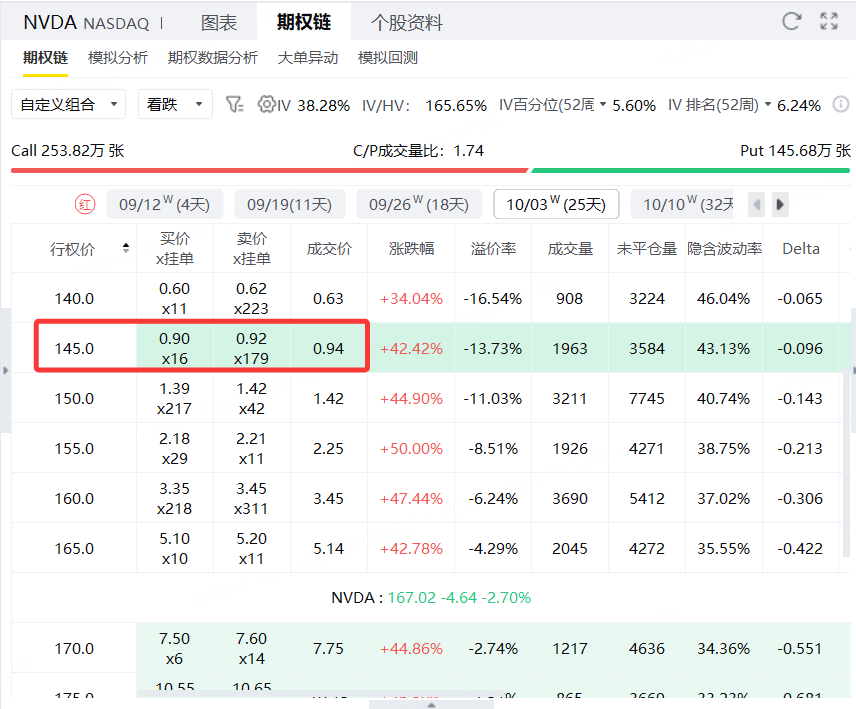
In the second step, you can also buy a put option with an exercise price of $145 and an expiration date of October 03 at a price of $0.94 (costing $91).
Stocks held: Nvidia (NVDA), 100 shares, current market price of $167, total value of about $16,700;
Sell a Call option (Call):
The exercise price is US $185, the expiration date is October 3, and premium is US $1.11 per share (a total of US $111 received);
Buy a Put option (Put):
The exercise price is US $145, the expiration date is October 3, and premium is US $0.94 per share (a total cost of US $94);
Premium Net Revenue:
Revenue: $111 for selling Call
Payouts: Buy Put costs $94
Net Revenue: + $17
Profit and loss analysis:
Maximum benefit (cap):
When Nvidia closes ≥ $185:
The stock can be sold at a maximum of $185 (exercised by the Call buyer);
Stock earnings: 185-167 = $18/share, total $1800
With premium net income of $17, the total maximum gain is: 1800 + 17 =$1817
Maximum loss (lower limit):
When Nvidia's closing price is ≤ $145:
Stocks are sold at up to $145 (Put is executed);
Stock loss: 167-145 = $22/share for a total of $2200
Subtracting net premium income of $17, the maximum loss is: 2200-17 =$2183
Break-even point:
Stock Bid Price-Net premium Income
I.e. 167-0.17 =$166.83
Disclaimer: Investing carries risk. This is not financial advice. The above content should not be regarded as an offer, recommendation, or solicitation on acquiring or disposing of any financial products, any associated discussions, comments, or posts by author or other users should not be considered as such either. It is solely for general information purpose only, which does not consider your own investment objectives, financial situations or needs. TTM assumes no responsibility or warranty for the accuracy and completeness of the information, investors should do their own research and may seek professional advice before investing.
