Enjoy META earnings week without guessing the ups and downs
$META Platforms, Inc. (META) $Third Quarter 2025 Financial Results will be released on Wednesday, October 29, 2025 after the market closes.
Wall Street analysts expect META Platforms (META) to report quarterly earnings of $6.60 per share in its upcoming report, representing a year-over-year increase of 9.5%. Revenue is expected to reach $49.43 billion, up 21.8% from the year-ago quarter.
META Platforms (META) is relying on strong ad revenue growth prospects to fuel its business. Despite macroeconomic uncertainty, Meta's ad revenue is expected to benefit from continued strong growth in ad spend as advertisers leverage its increasingly powerful artificial intelligence (AI) capabilities to deliver.
According to the Zacks Consensus Estimate, Meta's ad revenue for the third quarter of fiscal 2025 is expected to be $48.5 billion, up 21.6% year-over-year.
Meta-owned products-Facebook, WhatsApp, Instagram, Messenger and Threads-currently reach more than 3 billion users a day. Its phenomenal reach, along with the continued increase in ad impressions (up 11% year-on-year in Q2 2025), makes META one of the most important players in the digital advertising market, behind only Alphabet (GOOGL) and Amazon (AMZN).
According to eMarketer, global ad spend is expected to grow 7.4% in 2025 to $1.17 trillion, with Alphabet, Meta and Amazon accounting for about two-thirds of new ad spend.
However, Meta's increasing investment spending in developing more advanced models and AI services is expected to continue to weigh on margins. The Zacks Consensus Estimate for operating profit from the Family of Apps segment is $24.86 billion, up 14.1% year over year.
Meanwhile, the Reality Labs business is still losing money massively, which isn't good for Meta's third-quarter results. The consensus estimate for the segment's loss is $5.58 billion, which is larger than the $4.43 billion loss in the year-ago quarter.
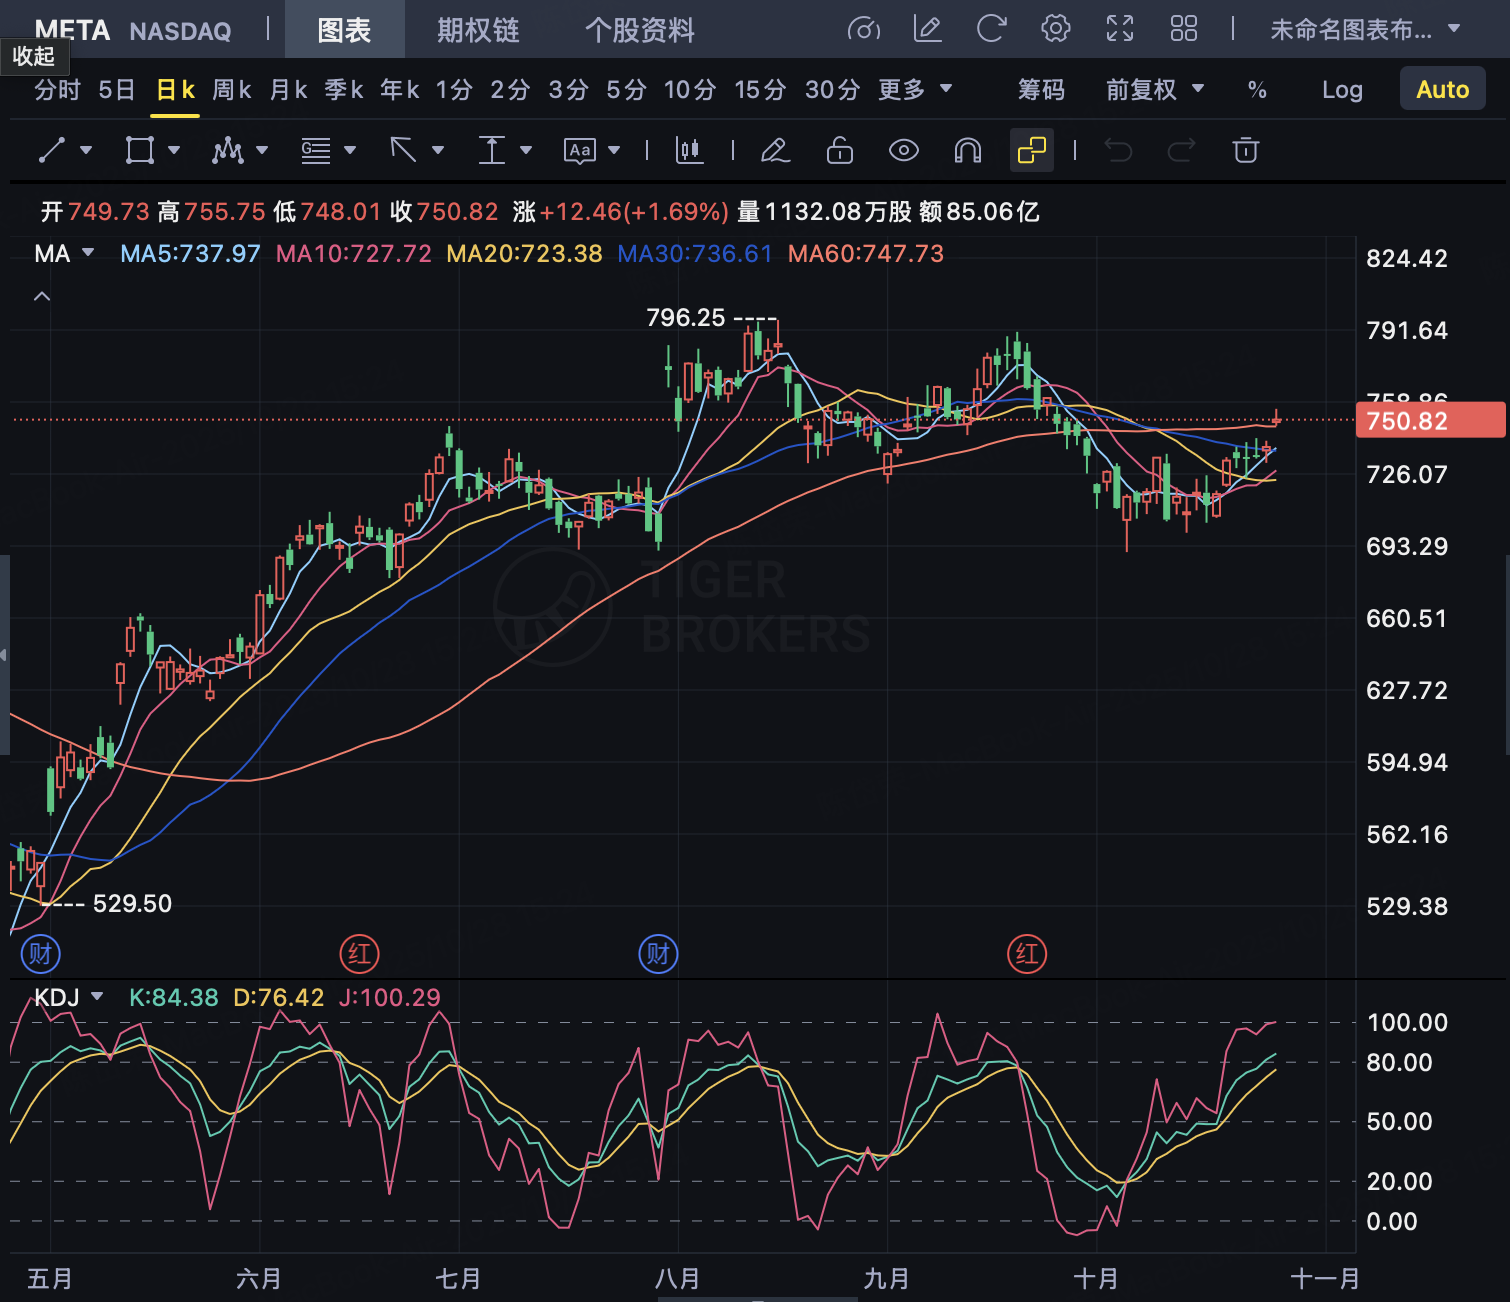
Meta's stock price has been volatile over the past few earnings seasons
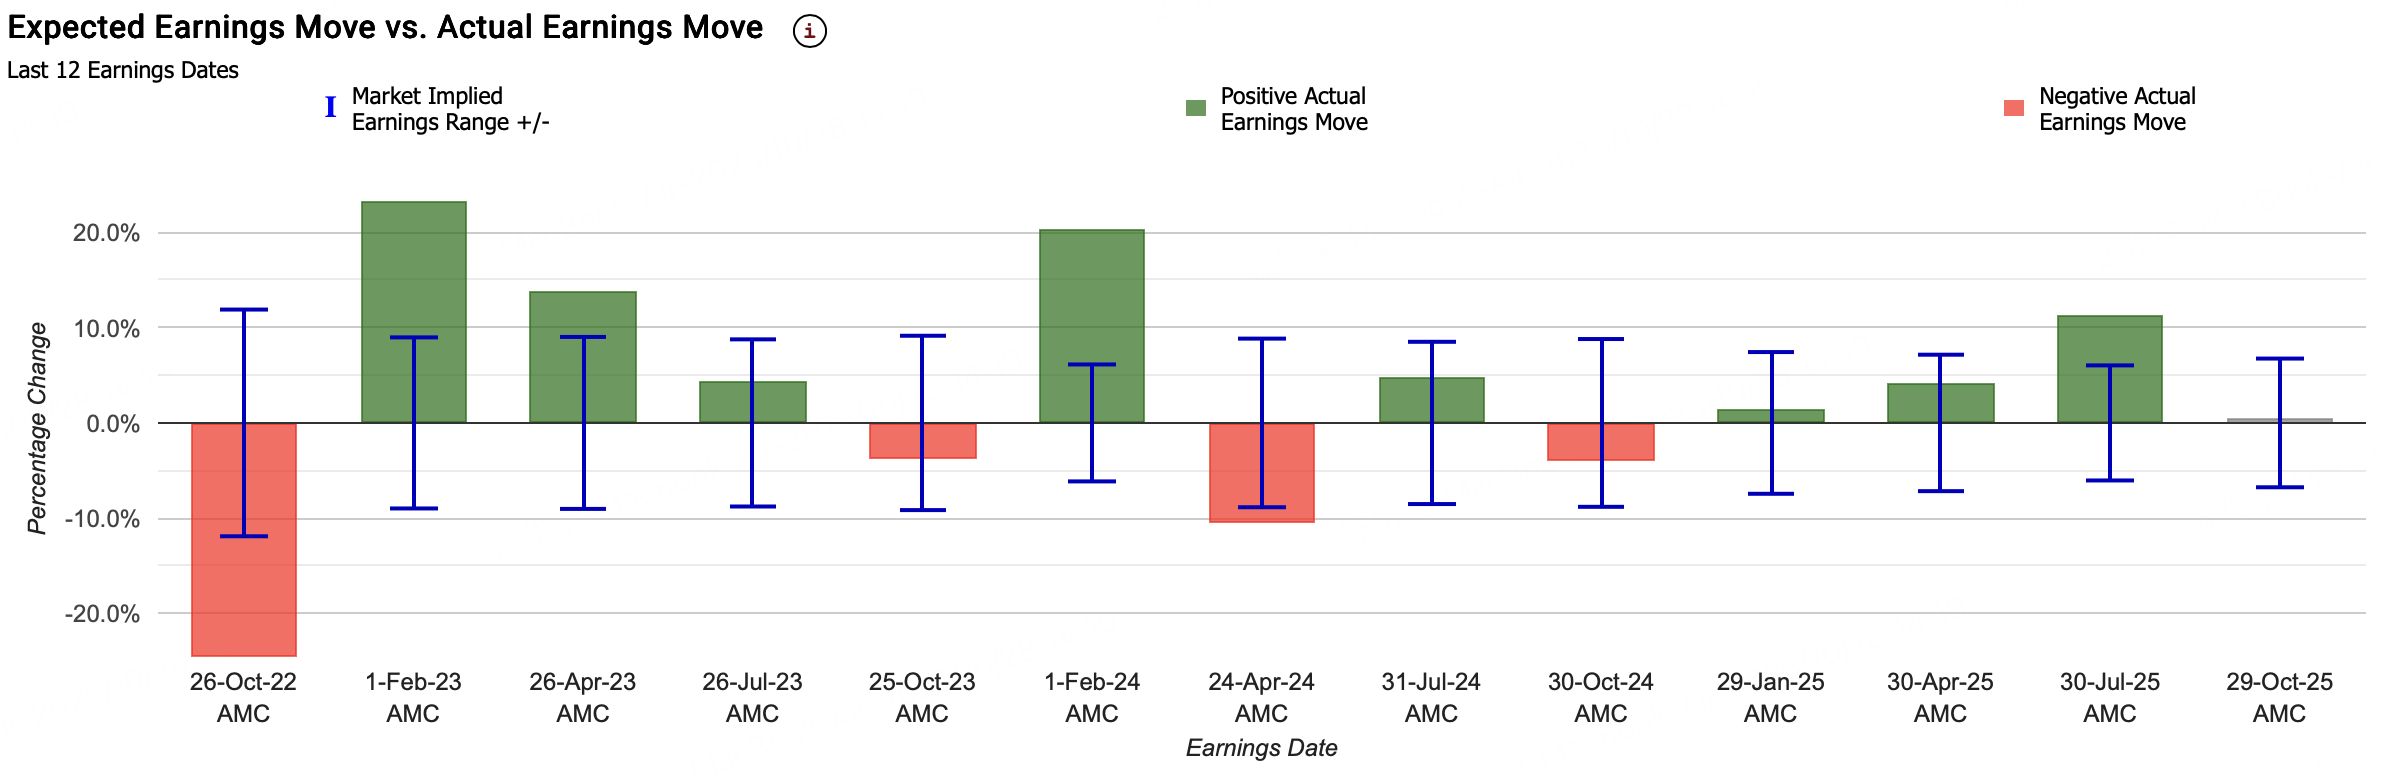
Over the past 12 quarters, the options market has overestimated the magnitude of share price volatility after META's earnings report 50% of the time. The average expected fluctuation range of the options market before the earnings report is±8.4%, but the average true fluctuation (absolute value) of META stock price after the actual financial report is announced reaches10.6%。 This suggests that META's actual earnings volatility usuallyMore dramatic than the options market expected。
Over the last six earnings seasons, Meta's actual stock price movements were:-10.6%, +4.8%,-4.1%, +1.6%, +4.2%, +11.3%
In response to this Meta performance release event, we takeIron Eagle strategy。
Iron Eagle strategy
Iron Eagle strategyIs a typicalNeutral Options Strategy, suitable for investors to believe that the price of the underlying asset willMaintain range shock, will not significantly break through the upper and lower boundaries.
It passes throughSell a near-in-the-money Call option (Call) and Put option (Put), whileBuy calls and puts with further strike pricesTo limit losses under extreme market conditions.
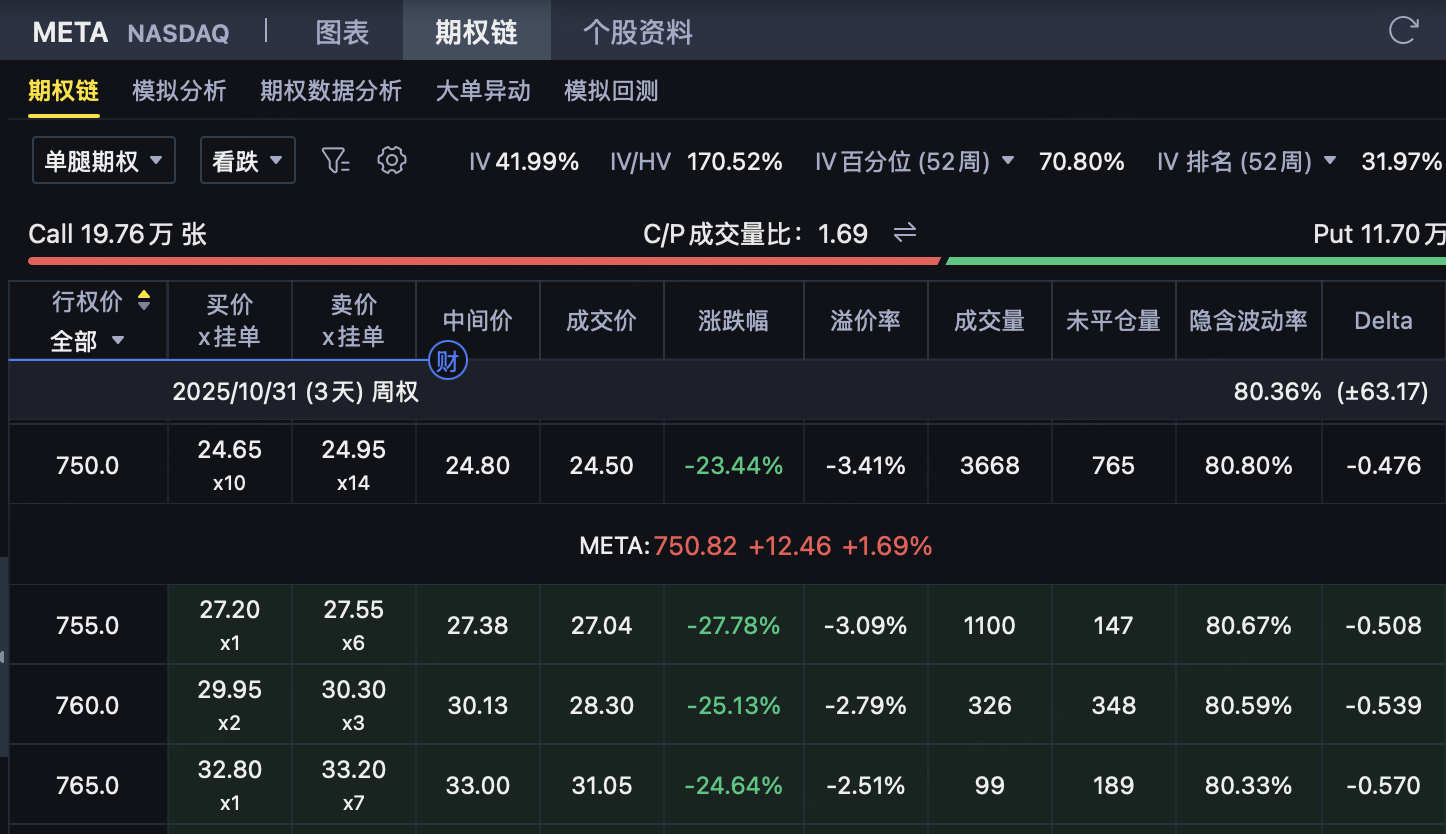
Investors judge that Meta's fluctuation range in the short term after the financial report is announced is limited. In the past three months, Meta's stock price is likely to remain at$700–$800Within interval. In order to obtain time value (Theta) returns while controlling risks, investors adoptIron Condor Strategy。
The specific structure is:
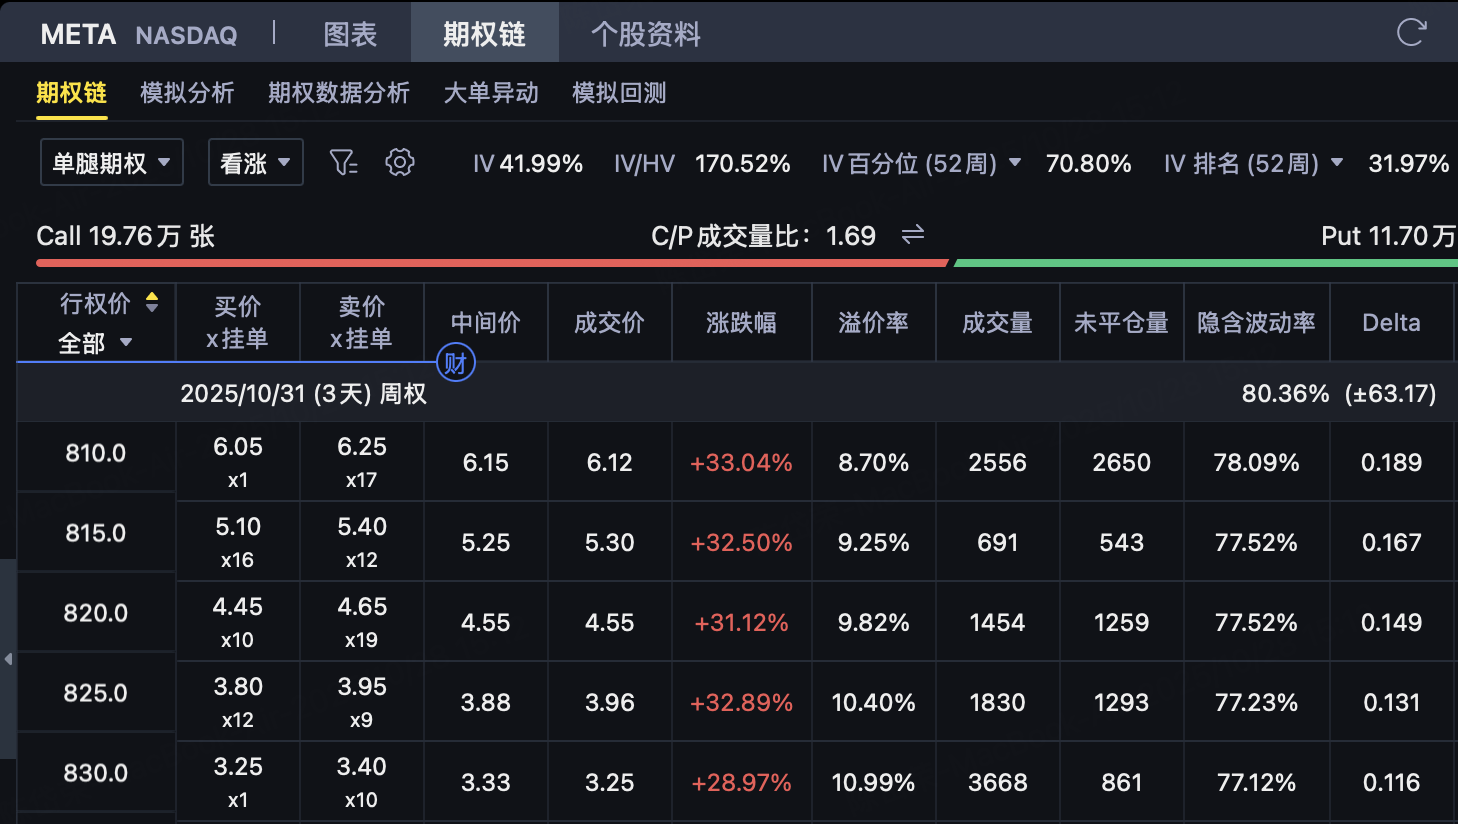
Sell $750 Put (Charge premium $24.5)
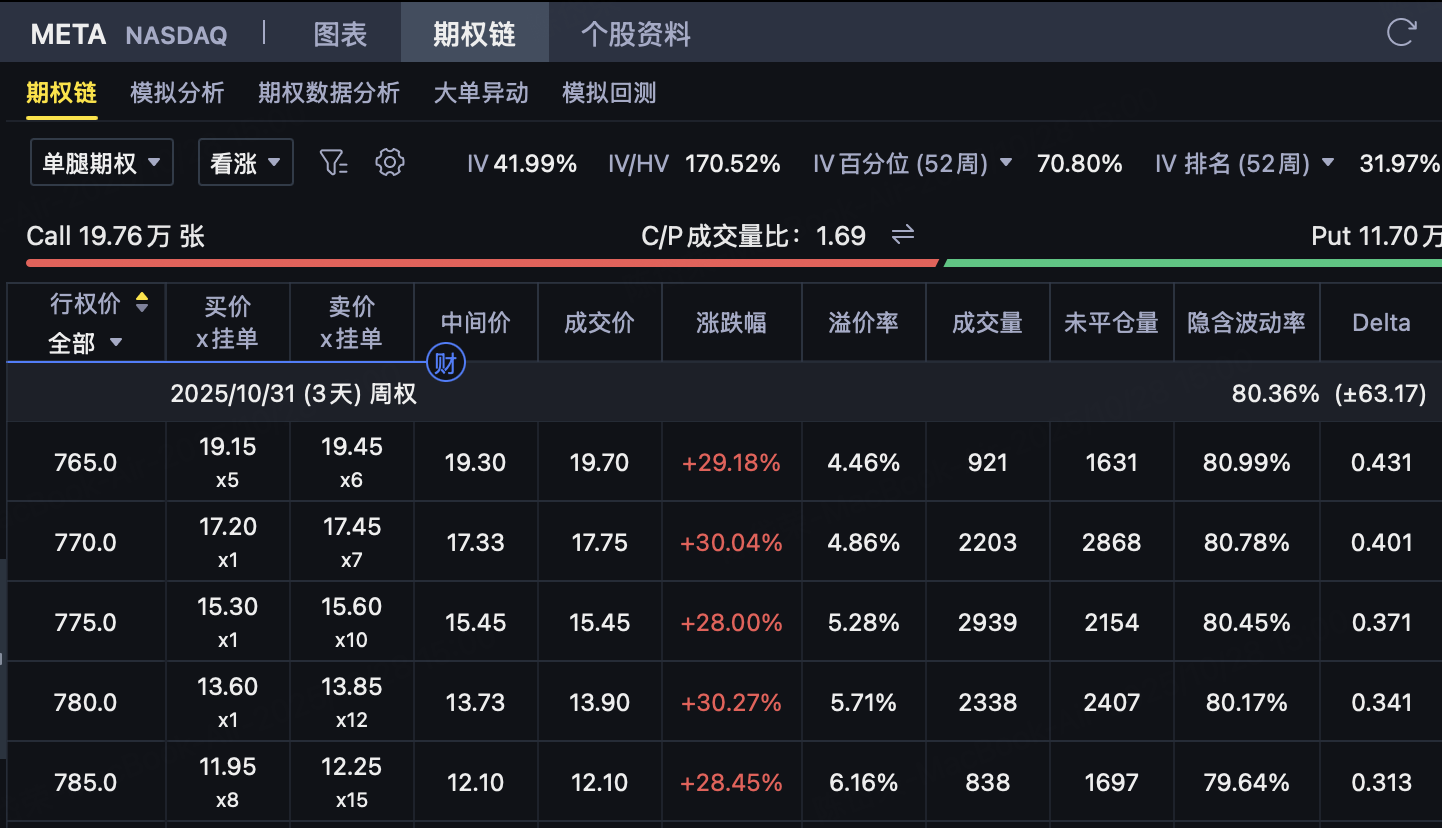
Sell $765 Call (Charge premium $19.7)
Buy $700 Put (Spend premium $6.8)
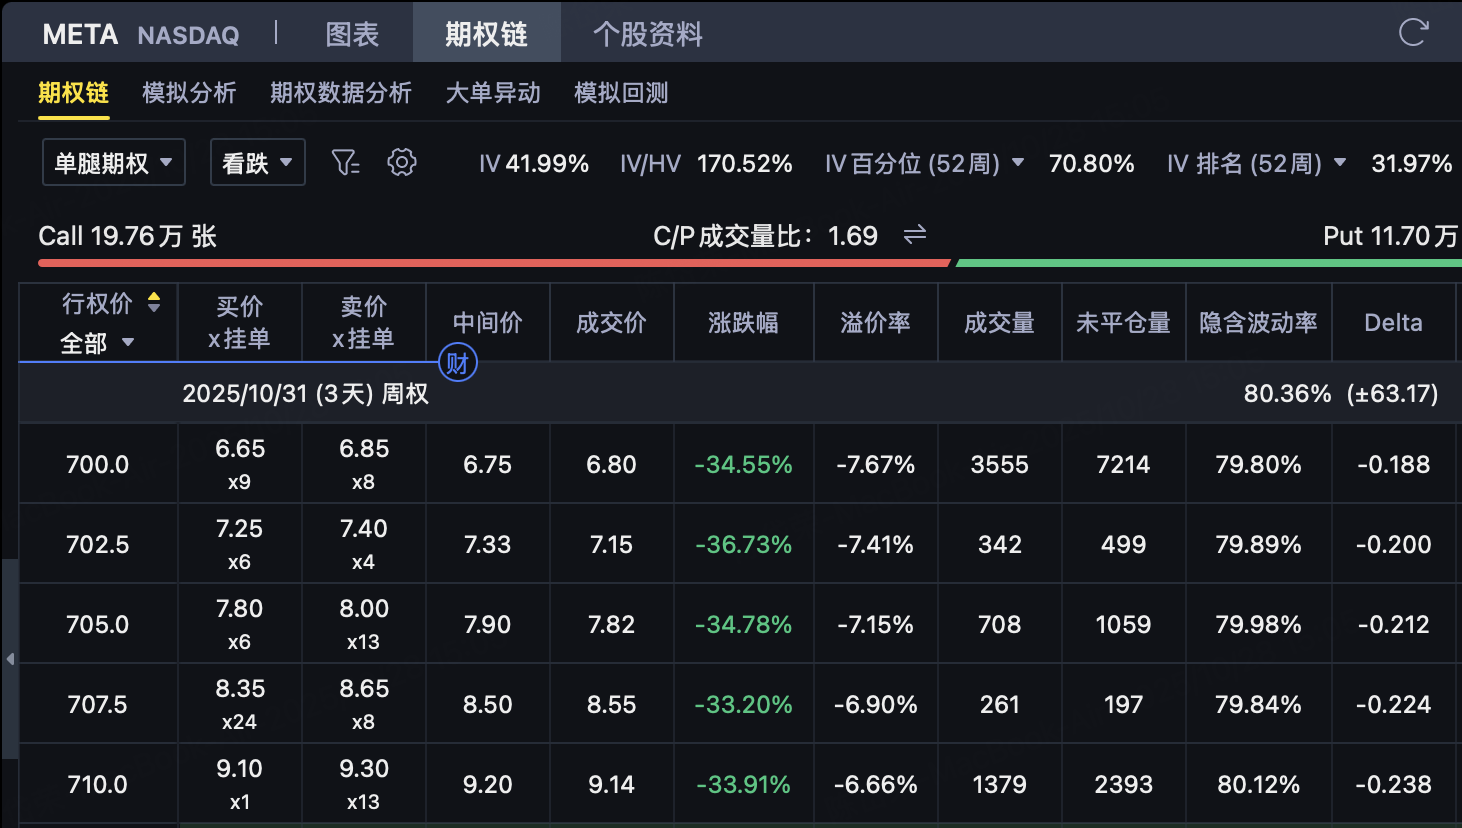
Buy $810 Call (payout premium $6.12)
Analysis of profit and break-even point
Net premium income: Revenue = (Sell 750P + Sell 765C) − (Buy 700P + Buy 810C) = (24.5 + 19.7) − (6.8 + 6.12) =$31.28/Share→ Net revenue per contract$3,128, which is strategicMaximum potential profit。
Profitability conditions: When the META share price is between$750 vs $765At that time, all options expire and invalidate, and the investor retains all premium of $31.28.
Break-even point below: $750 − $31.28 =$718.72→ If the stock price falls below $718.72, investors start losing money.
Above break-even point: $765 + $31.28 =$796.28→ If the stock price breaks through $796.28, investors start losing money.
Maximum loss (below): Put Spread Width = $750 − $700 = $50 Maximum Loss = Spread − Net premium = 50 − 31.28 =$18.72/Share(namely$1,872/Contract)
Maximum loss (above): Call Spread Width = $810 − $765 = $45 Max Loss = 45 − 31.28 =$13.72/Share(namely$1,372/Contract)
Strategy Characteristics and Risk Analysis
Profit logicThe main sources of income for investors are time value decay (Theta) and volatility fall (IV Crush). The implied volatility before the financial report is usually high. Once the financial report is released and the market fluctuations land, the IV will drop significantly, thus making the seller profit.
Risk characteristics
Unlike selling Strangle naked, Iron Eagle structure protects legs by buyingCompletely limits the maximum loss。
The downside limit loss is$1,872, the upside limit loss is $1,372, and the risk is determined when the position is opened.
The structure is no longer at risk of "unlimited loss".
Directional neutralityInvestors don't need to predict the rise and fall of META, just judge that the stock price will not break out of the range significantly after the earnings report. This allows the strategy to perform best when the market is volatile or mild.
Volatility risk
If the financial report causes the stock price to surge/plummet unilaterally, the strategy will touch the protective leg and lock in the maximum loss.
If the volatility does not fall or rises instead after the financial report, the option price may remain high, resulting in floating losses.
Time decay advantageEvery day, the time value of short-term options is rapidly lost (especially after the financial report). As long as the stock price is still within the balance range, the investor's profit-loss curve will continue to improve.
Disclaimer: Investing carries risk. This is not financial advice. The above content should not be regarded as an offer, recommendation, or solicitation on acquiring or disposing of any financial products, any associated discussions, comments, or posts by author or other users should not be considered as such either. It is solely for general information purpose only, which does not consider your own investment objectives, financial situations or needs. TTM assumes no responsibility or warranty for the accuracy and completeness of the information, investors should do their own research and may seek professional advice before investing.
