U.S. stocks' rebound momentum weakens, how to hedge
Last week (December 15 to December 21, 2025), the U.S. stock market as a whole showed a trend of differentiation. Led by continued strength in tech stocks, the Nasdaq 100 (QQQ) rose 1.42%, the S&P 500 (SPY) edged up 0.60%, while the traditional cyclical-heavy Dow Jones Industrial Average (DIA) fell 0.35%. Although the index level still maintains a rebound pattern, the rise is mainly concentrated in the technology sector. The strength and weakness within the industry are obviously differentiated, and the market as a whole has not formed a consistent upward trend.
From the perspective of drivers, AI-related themes and the rebound of large technology stocks have become the core support of the Nasdaq and S&P. The Nasdaq recorded its largest one-day gain of 1.45% in the week on December 18, while the S&P rebounded continuously on December 19 and 22, indicating that funds are still willing to allocate growth assets with higher certainty. At the same time, however, the performance of the consumer and industrial sectors was weak, and the decline of some heavyweights dragged down the trend of the Dow Jones Industrial Average, reflecting that under the current macro and policy uncertainty background, funds remain cautious about traditional cyclical industries.
It is worth noting that market volatility was significantly amplified last week. The amplitude of the three major indexes all exceeded 1.7% during the week. On December 17, the Nasdaq fell by 1.85% in a single day, which was impacted by the bad news of some technology stocks. On December 19, the expiration of the "Four Witch Day" option (record nominal scale) further amplified trading volume and short-term fluctuations. Coupled with the approaching Christmas holiday and the decline in liquidity, the market presents the typical characteristics of "rising but unstable".
From the perspective of funds and sentiment, technology-related assets are still attracting capital inflows, but the corresponding funds of the S&P and Dow have experienced periodic outflows, and the short selling ratio has remained relatively high, indicating that investors have not fully turned optimistic. At the macro level, the cooling of inflation data provides support for expectations of interest rate cuts, but the differences within the Federal Reserve on the policy path have left the market with doubts about the subsequent direction of interest rates. This uncertainty limits the room for further upward movement of the index.
On the whole, U.S. stocks are still in a rebound structure in the short term, but the upward momentum has been significantly weaker than the previous stage, and the risk of pullback/retracement is rising. In this context, the price-performance ratio of continuing to unilaterally chase long has declined, while direct short selling faces the uncertainty brought about by the resilience of technology stocks. A more robust response is through bear market bullish spreadsAnd other limited risk strategies, while retaining a certain rebound profit space, hedge potential downside risks, which is more in line with the current market environment with high volatility and low certainty.
QQQ Bear Call Spread Strategy
1. Strategy structure
Investors in$Nasdaq 100ETF (QQQ) $Create aCall spread Bull Call SpreadStrategy, from a sheet with the same maturity dateLow Strike Price Call LongWith a pieceHigh Strike Price Call ShortCombined. The strategy starts withGain rebound gains at limited costsFor the purpose, applicable to QQQStop the decline in the short term, but there is limited room for reboundThe judgment is common in the expectation of technical rebound after a bear market or a correction.
[Image]
(1) Buy Call (low execution price, core bullish)
Buy Call with strike price K ₁ = 624
Pay premium: $0.90

The option, which gives investors the right to buy QQQ at $624 before the expiration date, is the primary bullish source for the strategy.
(2) Sell Call (high execution price, limited income)
Sell Call with strike price K ₂ = 629
Premium charged: $0.15
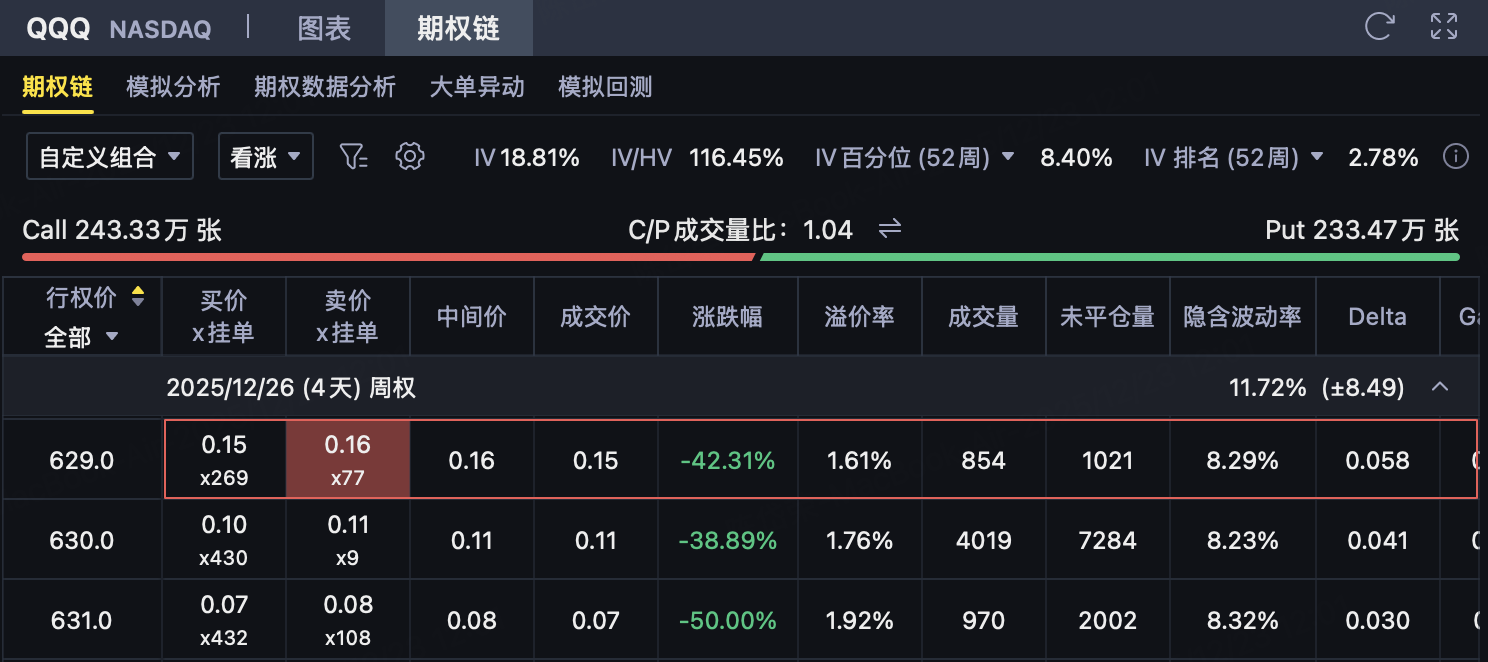
This option is used to reduce the overall cost while limiting the maximum profit range.
2. Initial net cost (maximum investment)
The net cost of the Call spread is the expenditure on buying Call minus the income on selling Call:
Net cost (per share):= 0.90 − 0.15 =$0.75
1 lot of options = 100 shares, so:
Funds required to open a position (per contract):= 0.75 × 100 =$75/contract
This value is also of the policyMaximum possible loss。
3. Maximum profit
When QQQ Expiration Price≥ $629Time:
The 624 Call bought is in the money
The 629 Call sold was also executed
The spread between the two options is fully locked
Strike spread:= 629 − 624 = $5
Maximum profit (per share):= Strike spread − Net cost = 5 − 0.75 =$4.25
Maximum profit (per contract):= 4.25 × 100 =$425/contract
4. Maximum loss
When QQQ Expiration Price≤ $624Time:
Both Call options are out-of-the-money
All invalid when expired
Investor losses have all been paid premium.
Maximum loss (per share):= $0.75
Maximum loss (per contract):= 0.75 × 100 =$75/contract
The risk of this strategy is completely limited and can be accurately calculated beforehand.
5. Break-even point
The call spread is onlyA break-even point:
Break-even price:= Buy Call Strike Price + Net Cost = 624 + 0.75 =$624.75
Maturity judgment rules:
QQQ > $624.75 → Earnings
QQQ = $624.75 → Flat
QQQ < $624.75 → Loss
6. Risk and return characteristics
Maximum benefit:$425/Contract (Limited)
Maximum loss:$75/contract (limited)
Profit and loss ratio:Gain: Loss ≈ 425: 75 ≈5.67: 1
Strategy features:
Small capital occupation and high leverage efficiency
Risks and benefits are determined in advance
Suitable inGet a limited rebound in a bear market or downtrend
Not suitable for pursuing big trend breakthroughs (earnings are capped)
Applicable scenarios:
When investors judgeQQQ is close to a phased low and may rebound in the short term, but it is difficult to break through significantlyAt that time, you can use this bear market bullish spread strategy to obtain the cost-effective income brought by the rebound to around 629 on the premise that the maximum loss is only $75.
Disclaimer: Investing carries risk. This is not financial advice. The above content should not be regarded as an offer, recommendation, or solicitation on acquiring or disposing of any financial products, any associated discussions, comments, or posts by author or other users should not be considered as such either. It is solely for general information purpose only, which does not consider your own investment objectives, financial situations or needs. TTM assumes no responsibility or warranty for the accuracy and completeness of the information, investors should do their own research and may seek professional advice before investing.
