After Micron's surge, how to hedge at a high level
Recently,$Micron Technology (MU) $The stock price performed strongly, continuously hitting new historical highs. As of December 24, 2025, it closed at US $276.27, and once hit US $281.86 during the session. The cumulative increase in three days exceeded 22%, and the trading volume was also significantly enlarged, indicating that the market heat remains high. In terms of fundamentals, the company's profitability has steadily improved, with TTM earnings per share reaching US $10.54, a P/E of 26.21 times, higher than the industry average; The price-to-sales ratio is 7.35 x, indicating that investors are highly recognized for its revenue growth prospects. Management's performance guidance is optimistic. It is expected that the median revenue in the next fiscal quarter will be US $18.7 billion, far exceeding market expectations, and it is expected that the high-bandwidth memory chip (HBM) market will achieve a compound annual growth rate of 40% in the next three years. At the same time, the company is actively expanding production capacity and plans to raise capital expenditures to US $20 billion in 2026 to meet the continued growth of customer demand.
However, despite the sharp recent rally, judging from market dynamics and high base effect, Micron stock price in the short termIt is difficult to maintain the same magnitude of rapid rise。 First of all, the stock price has approached historical highs, and there is a valuation buffer zone that lacks significant support in the short term; Secondly, although the company's production capacity has expanded, it still faces the problems of tight supply and demand and high concentration of customer orders, further pushing up supply chain costs and uncertainties; Finally, high P/E and price-to-sales ratio mean that the market's expectations for future performance growth have been fully reflected in the stock price, and there is limited room for short-term additional upside. Therefore, investors should be cautious about the risk of continuing to chase the rise at the current high level, and can consider structured derivatives or conservative strategies to control downside risks.
MU Bear Market Call Spread Strategy Earnings Analysis
1. Strategy structure
Investors Build a on MU (Micron Technology)Bear Call Spread Bear Call SpreadStrategy, from a sheet with the same maturity dateLow Strike Price Call ShortWith a pieceHigh strike price Call longCombined.
This strategy is suitable for investors who judge that MU's stock price has been high recently and the short-term upside space is limited, hoping to obtain premium gains while controlling risks.
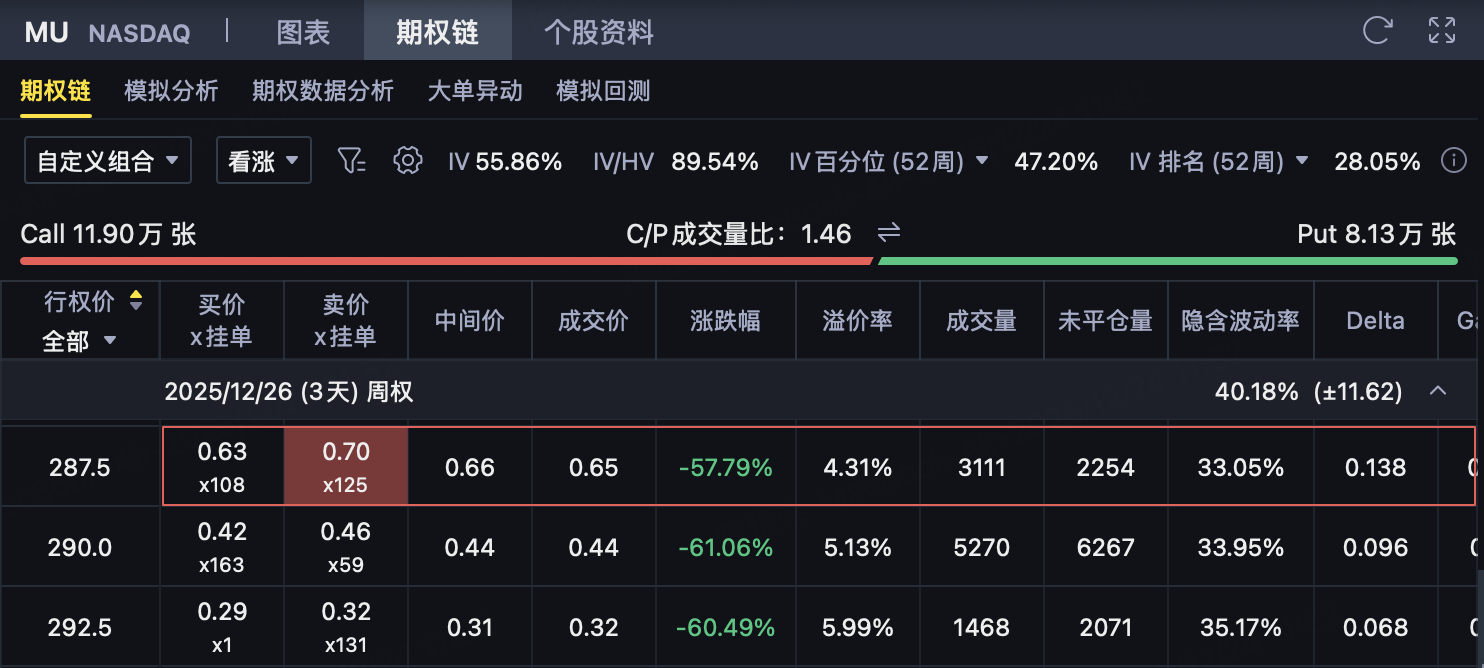
(1) Sell Call (low execution price)
Strike price K ₁ = 282.5
Premium charged: $1.51
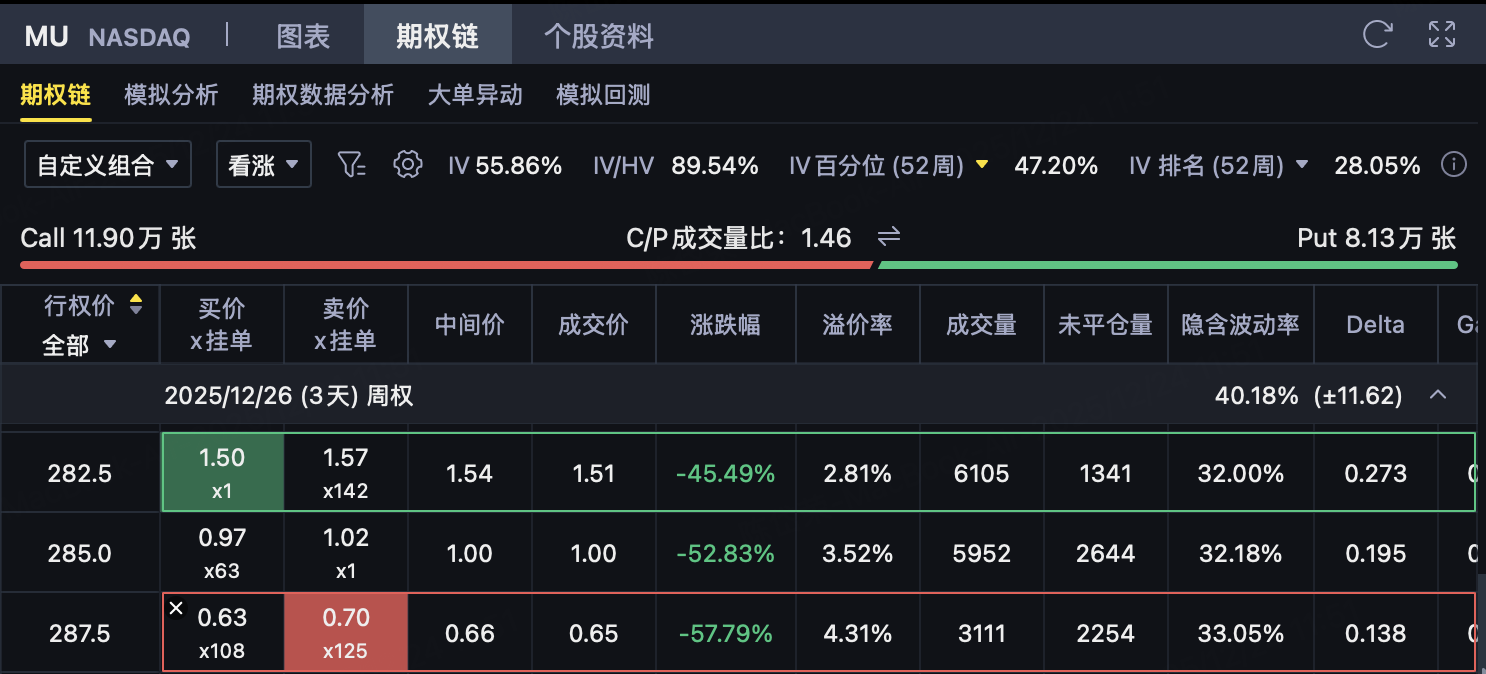
(2) Buy Call (high execution price)
Strike price K ₂ = 287.5
Pay premium: $0.65
2. Initial net premium
Net premium (per share):
= income from selling calls − expenses from buying calls
= 1.51 − 0.65
= $0.86
Capital occupation per contract:
= 0.86 × 100
= $86
3. Maximum profit
When the MU maturity price is ≤ US $282.5, both Calls are out-of-the-money maturities, and investors retain all net premium.
Maximum profit:
$0.86/Share
$86/contract
4. Maximum loss
When the MU expiration price is ≥ $287.5, the strike spread is fully locked.
Maximum loss (per share):
= (287.5 − 282.5) − 0.86
= $4.14
Maximum loss (per contract):
= $414
5. Break-even point
Break-even price:
= Sell Call Strike Price + Net premium
= 282.5 + 0.86
= $283.36
Maturity judgment:
MU < 283.36 → Profit
MU = 283.36 → flat
MU > 283.36 → Loss
6. Risk and return characteristics
Maximum gain: $86/contract (limited)
Maximum loss: $414/contract (limited)
Profit to Loss Ratio Approximately 1: 4.8
Time value is good for investors, risks are manageable
Suitable for shocks or slight corrections where the stock price is already high and the short-term upside space is limited
Disclaimer: Investing carries risk. This is not financial advice. The above content should not be regarded as an offer, recommendation, or solicitation on acquiring or disposing of any financial products, any associated discussions, comments, or posts by author or other users should not be considered as such either. It is solely for general information purpose only, which does not consider your own investment objectives, financial situations or needs. TTM assumes no responsibility or warranty for the accuracy and completeness of the information, investors should do their own research and may seek professional advice before investing.
