Elliott Wave in Action: XOM Rockets from Blue Box Area
In this technical blog, we will look at the past performance of the 1-hour Elliott Wave Charts of Exxon Mobil Corporation ticker symbol: XOM. In which, the rally from 25 November 2025 low unfolded as an impulse structure. But showed a higher high sequence favored more upside extension to take place. Therefore, we advised members not to sell the stock & buy the dips in 3, 7, or 11 swings at the blue box areas. We will explain the structure & forecast below:
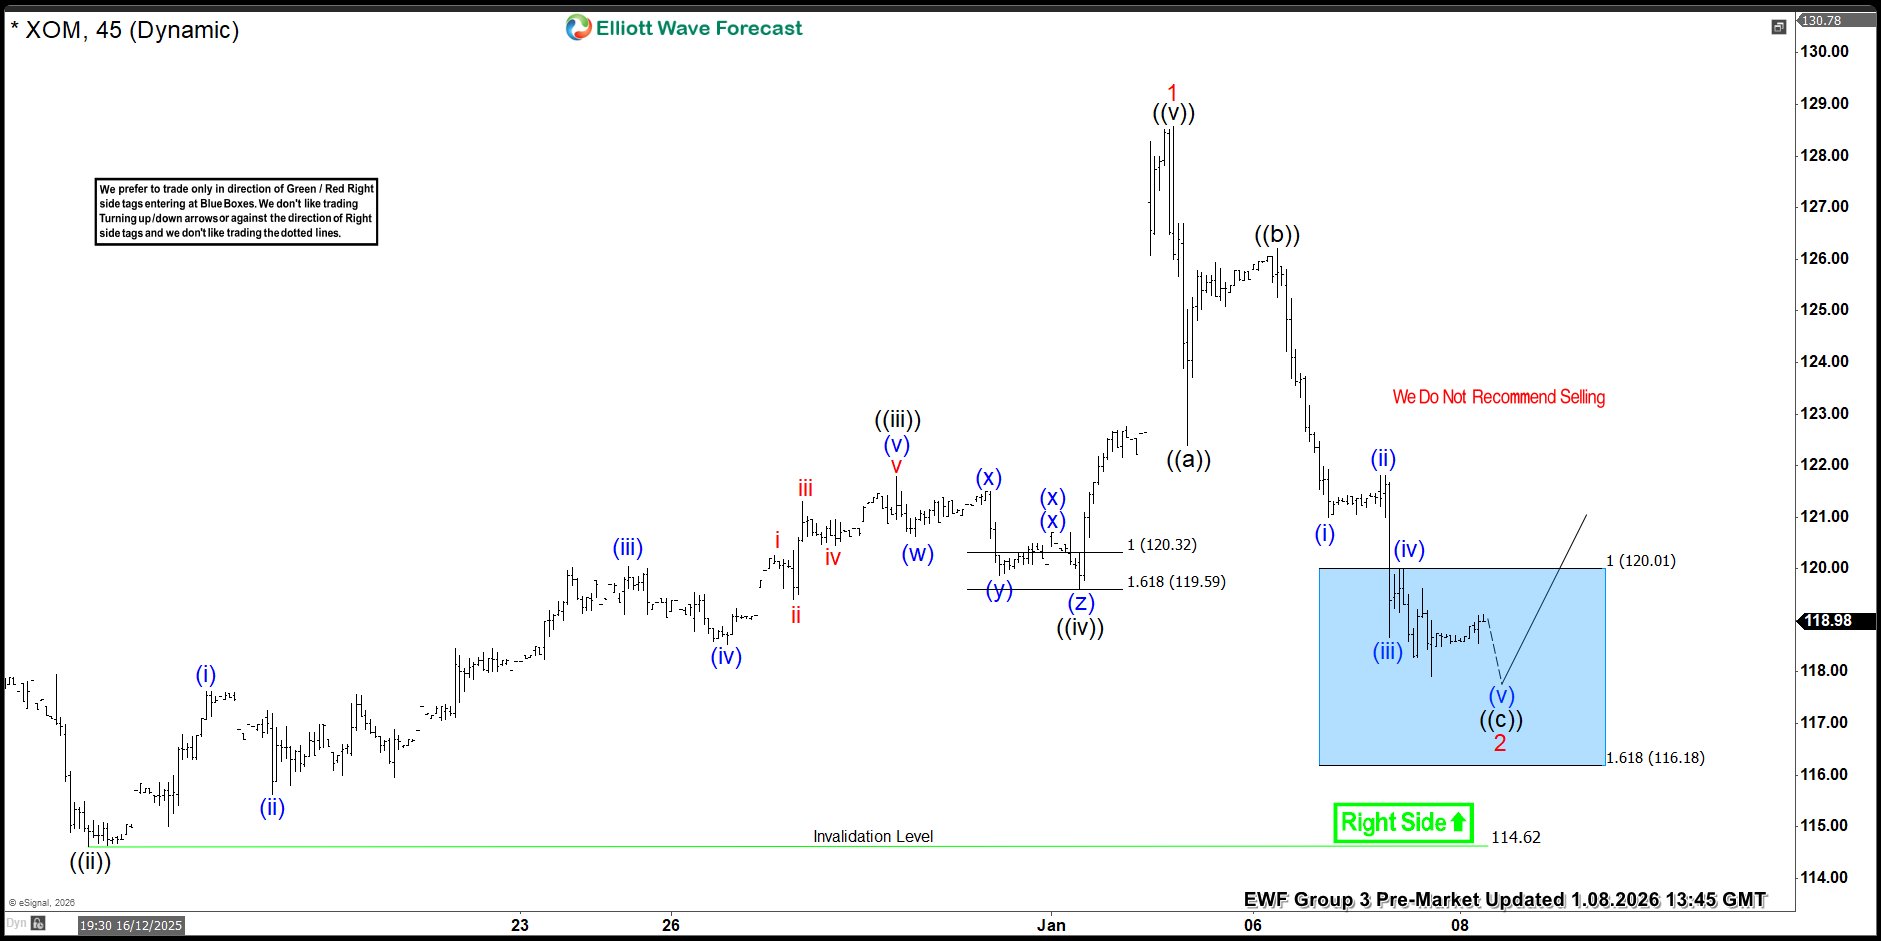
XOM 1-Hour Elliott Wave Chart From 1.08.2026
Here’s the 1-hour Elliott wave chart from the 1.08.2026 Pre-Market update. In which, the cycle from the 25 November 2025 low ended in wave 1 at $128.57 high. Down from there, the stock made a pullback in wave 2. The internals of that pullback unfolded as Elliott wave zigzag correction where wave ((a)) ended at $122.39 low. Then a bounce to $126.20 high ended wave ((b)) & wave ((c)) managed to reach the blue box area at $120.01- $116.18 equal legs area. From there, buyers were expected to appear looking for the next leg higher or for a 3 wave bounce minimum.
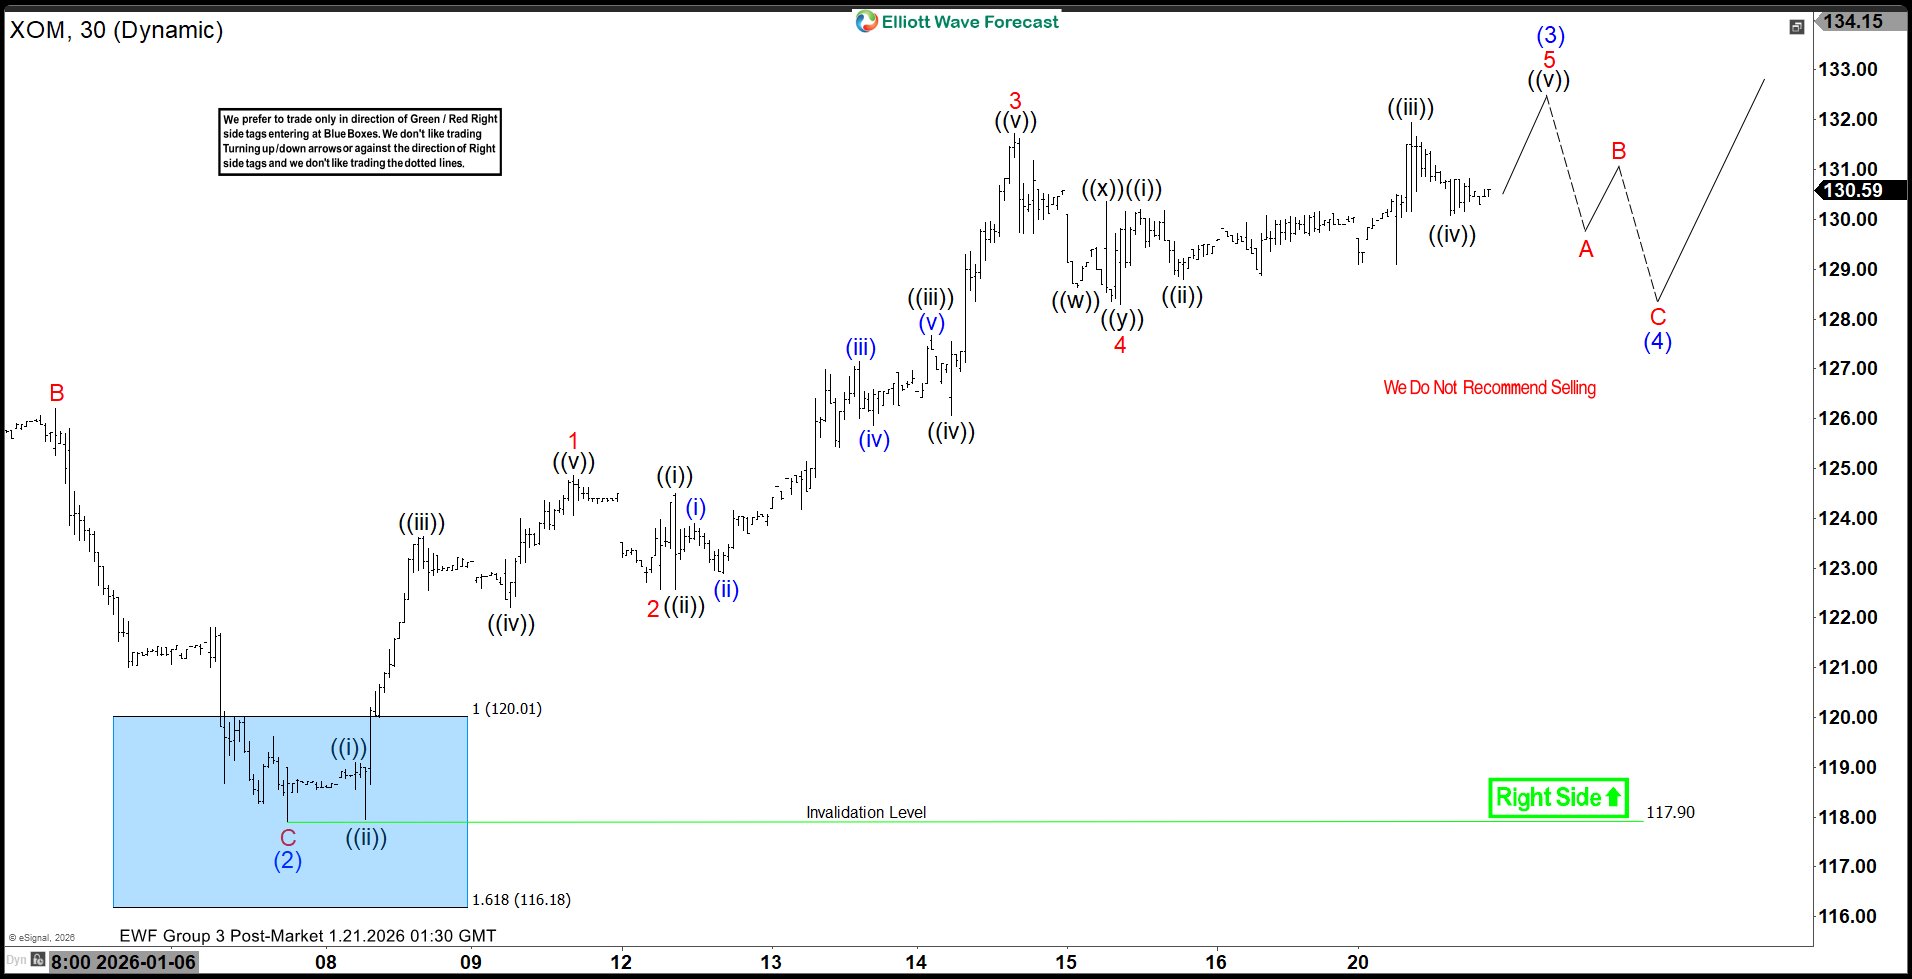
XOM Latest 1-Hour Elliott Wave Chart From 1.21.2026
This is the latest 1-hour Elliott wave Chart from the 1.21.2026 Post-Market update. In which the XOM is showing a very nice reaction higher taking place, right after ending the zigzag correction within the blue box area. Allowed members to create a risk-free position shortly after taking the long position at the blue box area. Since then the stock made a new highs once again confirming the next leg higher towards $132.34- $141.28 target area before profit taking & next pullback takes place.
If you are looking for real-time analysis in XOM along with the other Stocks & ETFs then join us with a 14-Day Trial for the latest updates & price action.
Success in trading requires proper risk and money management as well as an understanding of Elliott Wave theory, cycle analysis, and correlation. We have developed a very good trading strategy that defines the entry.
Stop loss and take profit levels with high accuracy and allow you to take a risk-free position, shortly after taking it by protecting your wallet. If you want to learn all about it and become a professional trader. Then join our service by taking a Trial
Disclaimer: Investing carries risk. This is not financial advice. The above content should not be regarded as an offer, recommendation, or solicitation on acquiring or disposing of any financial products, any associated discussions, comments, or posts by author or other users should not be considered as such either. It is solely for general information purpose only, which does not consider your own investment objectives, financial situations or needs. TTM assumes no responsibility or warranty for the accuracy and completeness of the information, investors should do their own research and may seek professional advice before investing.
- glitzii·01-22Spot on analysis! XOM's bounce from the blue box is pure gold. [得意]LikeReport