$HSI(HSI)$ Price is on a short-term uptrend and is currently trading above both the 20 MA (orange line, at ~24,373) and the 50 MA (yellow curvy line at ~24,588). After bottoming out in late June, the market staged a sharp impulse recovery. Reclaiming both the 20 MA and 50 MA confirms that near-term momentum has shifted back to the bulls. Furthermore, the 20 MA crossing back above the 50 MA indicates short-term bullish acceleration. RSI at 60, There is still room for the index to push higher before becoming technically exhausted after RSI 70. With the clear uptrend yellow straight line that i drawn, not the wavy curvy one, long as price respects this yellow boundary on pullbacks, the path of least resistance remains upward in the short term.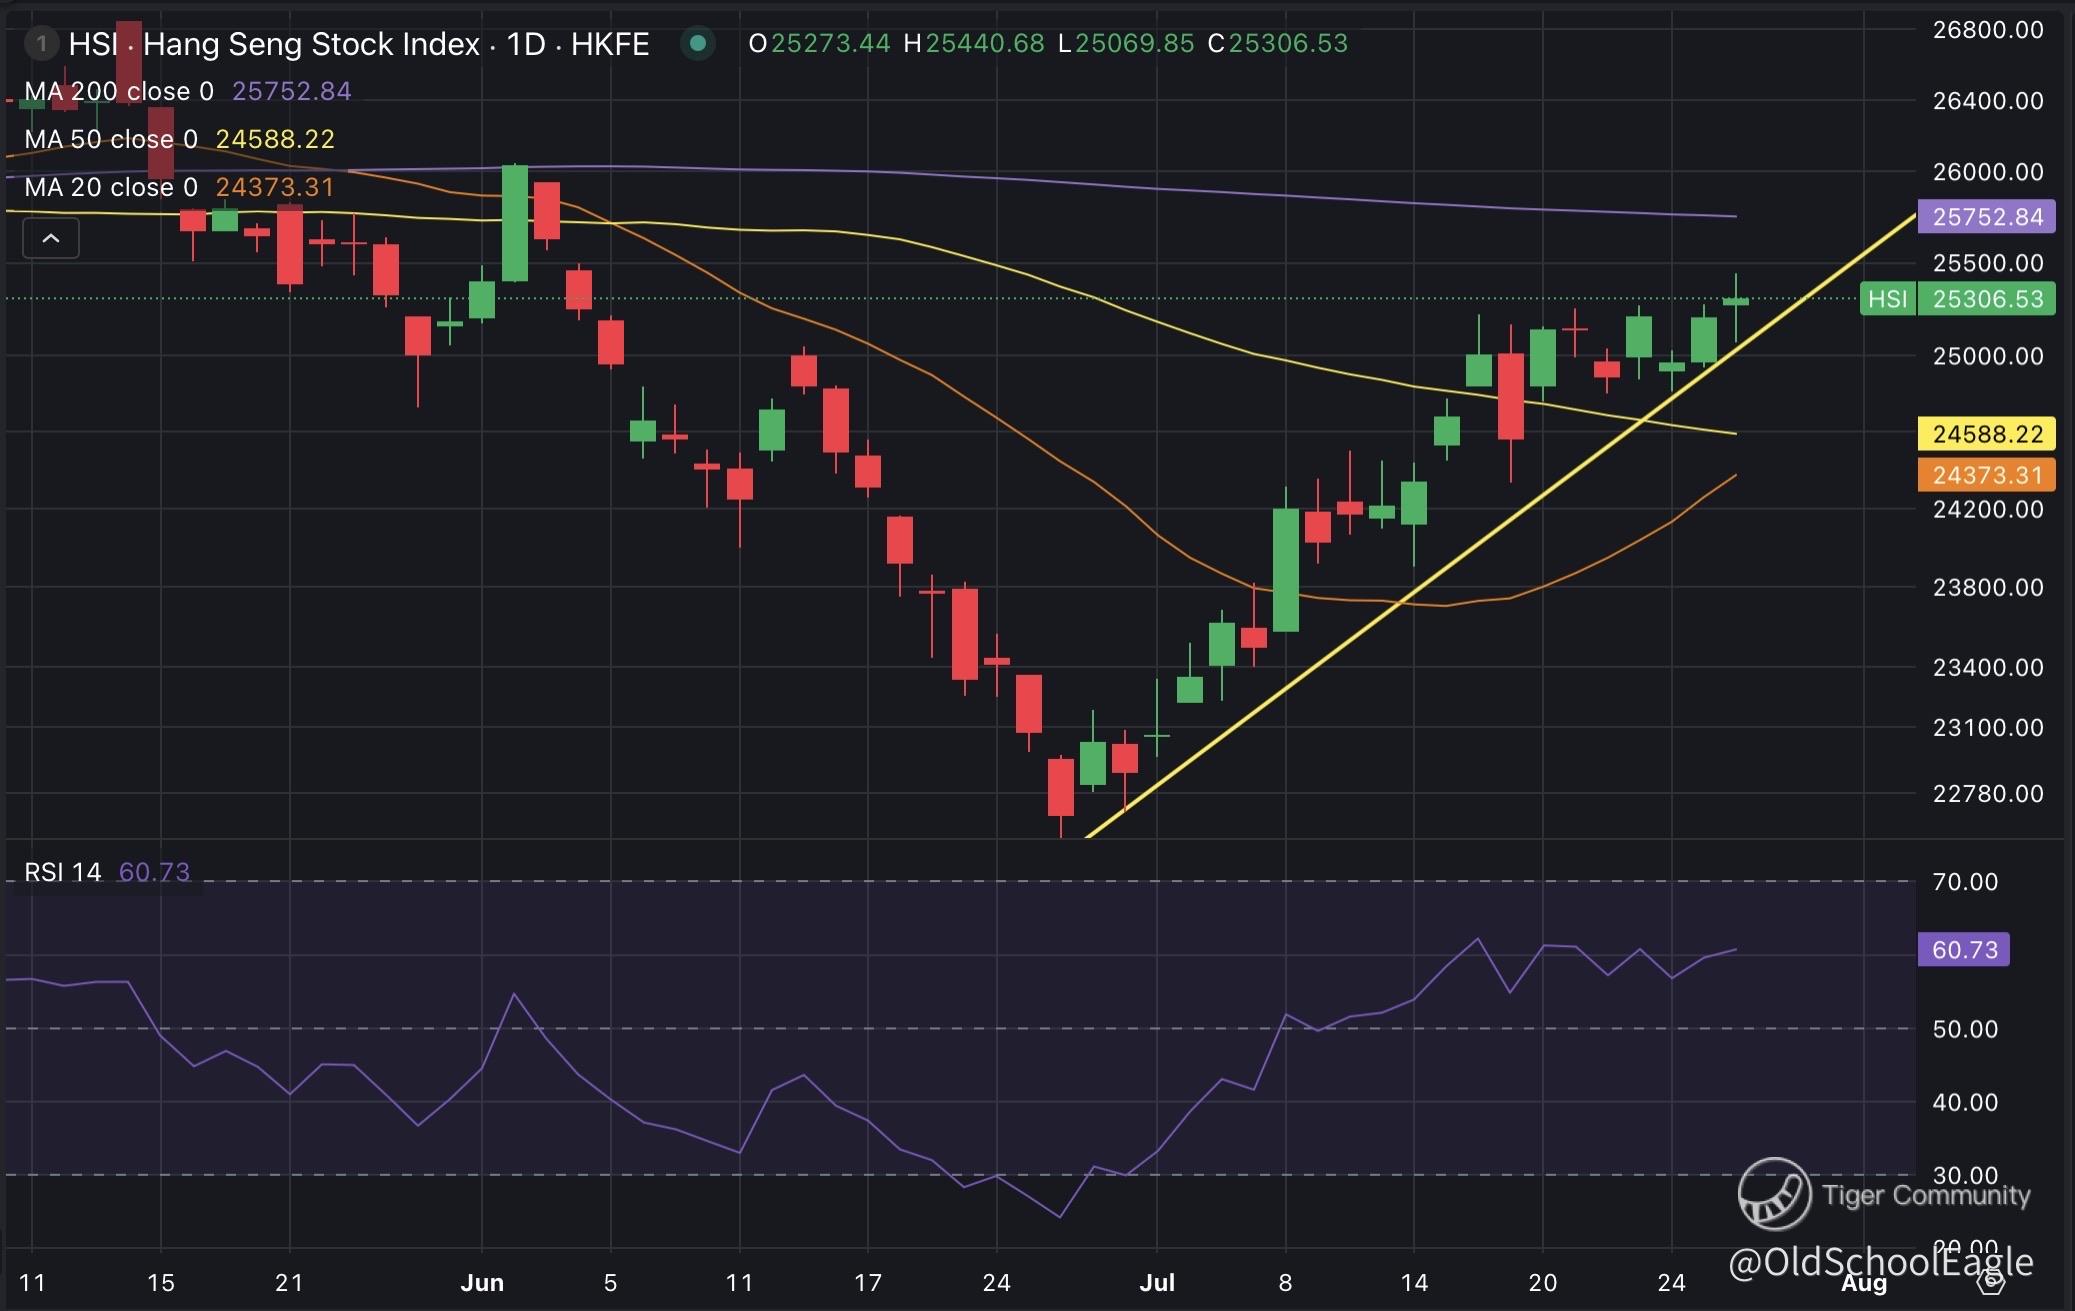
Disclaimer: Investing carries risk. This is not financial advice. The above content should not be regarded as an offer, recommendation, or solicitation on acquiring or disposing of any financial products, any associated discussions, comments, or posts by author or other users should not be considered as such either. It is solely for general information purpose only, which does not consider your own investment objectives, financial situations or needs. TTM assumes no responsibility or warranty for the accuracy and completeness of the information, investors should do their own research and may seek professional advice before investing.


