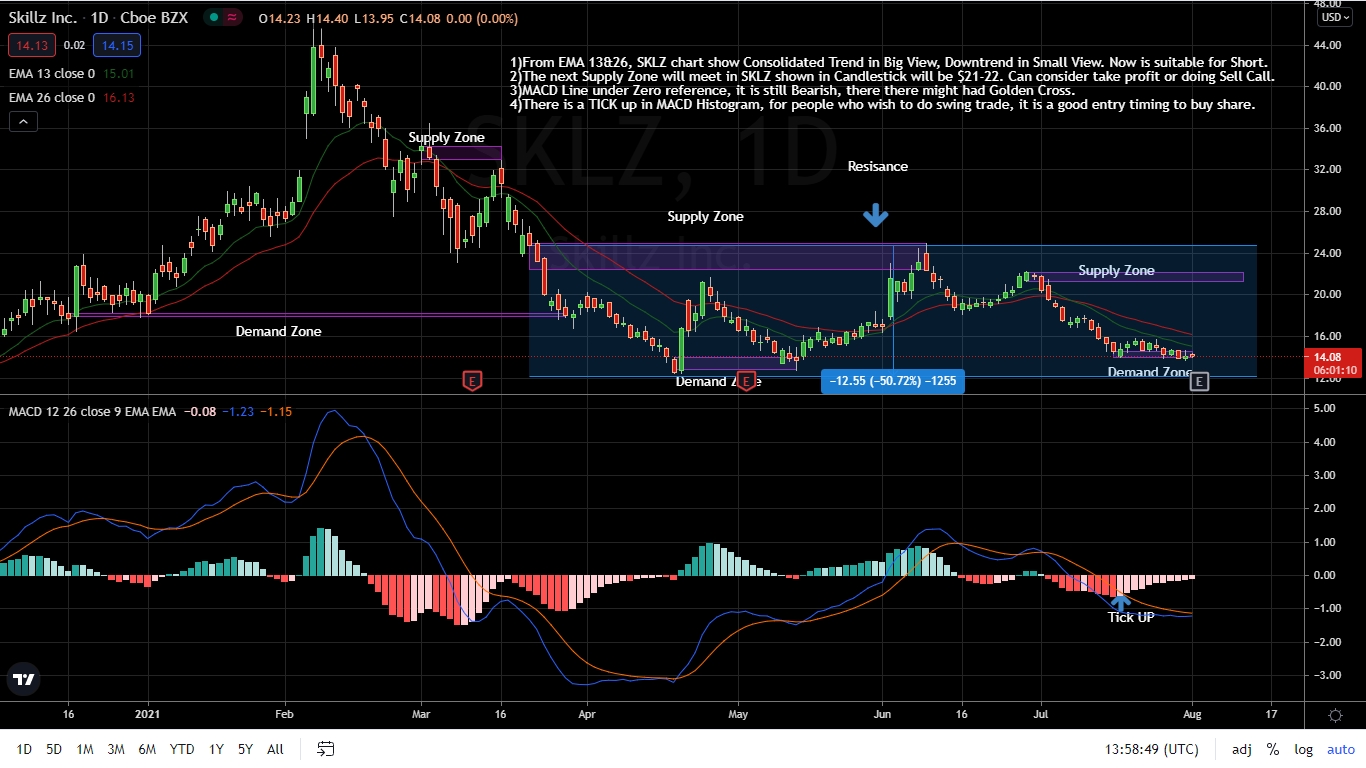
If you not buying SKLZ share via Fundamental Analysis but via Technical Analysis, what can we seen from the TA chart from EMA13&26, MACD and Candlestick Supply Zone and Demand Zone.
Here is the sharing welcome to comment.
Disclaimer: Investing carries risk. This is not financial advice. The above content should not be regarded as an offer, recommendation, or solicitation on acquiring or disposing of any financial products, any associated discussions, comments, or posts by author or other users should not be considered as such either. It is solely for general information purpose only, which does not consider your own investment objectives, financial situations or needs. TTM assumes no responsibility or warranty for the accuracy and completeness of the information, investors should do their own research and may seek professional advice before investing.
