Three Major Types of J.O.I.T(2)
Jayce's Options Intraday Trade(J.O.I.T)
- 1. Three Major Types of Trades
- 1.1 Premarket Trendline Breakout (PMTB)
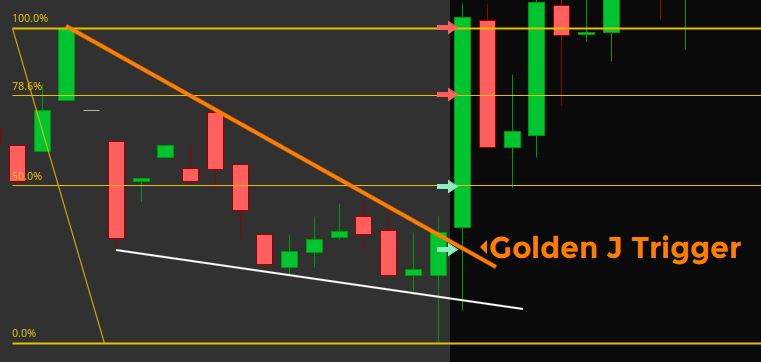
Since this is a beginner guide and I assume you do not have experience reading price action, let's use Fibonacci retracement levels as the entry and exit points. First draw a premarket trendline by connecting the highs of the premarket candlesticks. Then, draw a Fibonacci retracement from the high to the low of premarket. We wait for the price to breakout of premarket trendline. I call this the golden J trigger. We can enter calls at the golden J trigger level or at 50% retracement level, with stop-loss at a close below the premarket low. Our target is premarket high as that level tends to act as a resistance at the opening. If the price keeps getting rejected before reaching premarket high, can look for exit at around 78.6% retracement level. The goal is to not let a green trade turns red. Always secure profits. Set limit sell orders before the target is reached or when you are satisfied with the gains as the first 15min can be very volatile and the price might reverse sharply any time.
- 1.2 30min ORB (Opening Range Breakout)
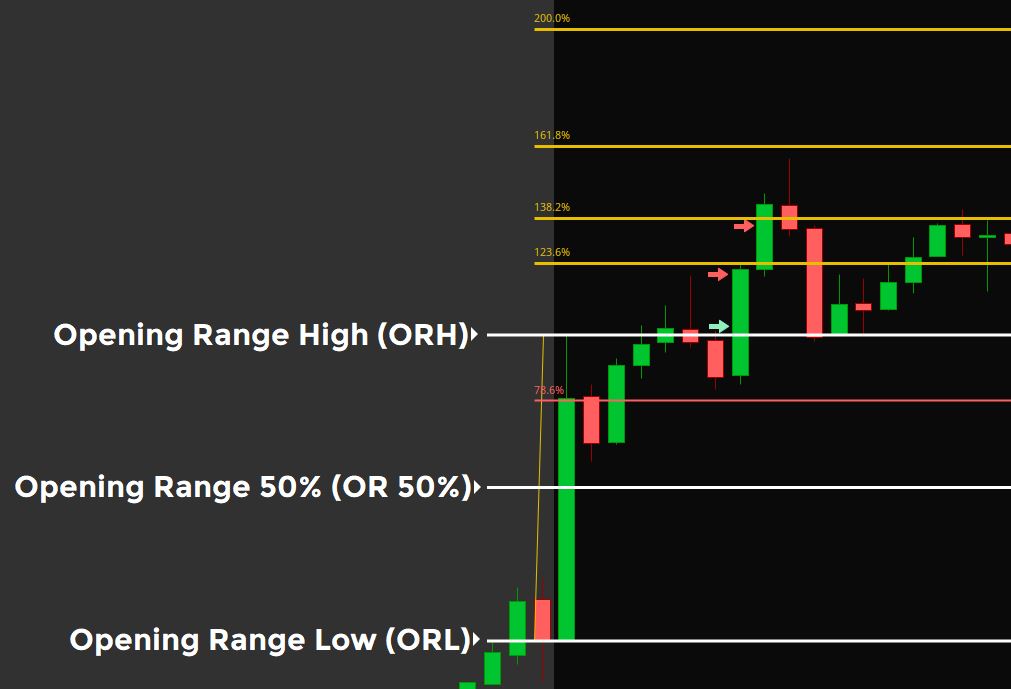
For 30min ORB, we draw a Fibonacci retracement from ORH to ORL. We can enter calls when it breaks over and retest ORH level, with stop-loss at a close below 78.6% retracement level. We trim our position by taking profit at every Fibonacci level (123.6%, 138.2%, 161.8%, 200%). As the price goes over each level, set a limit stop order at the previous level. This will prevent a winning trade from becoming a losing one. We can always sell all at the first target too. Small wins compound. We can also enter the trade again at another ORH retest with the same plan in mind.
- 1.3 10% Reversal (10R)
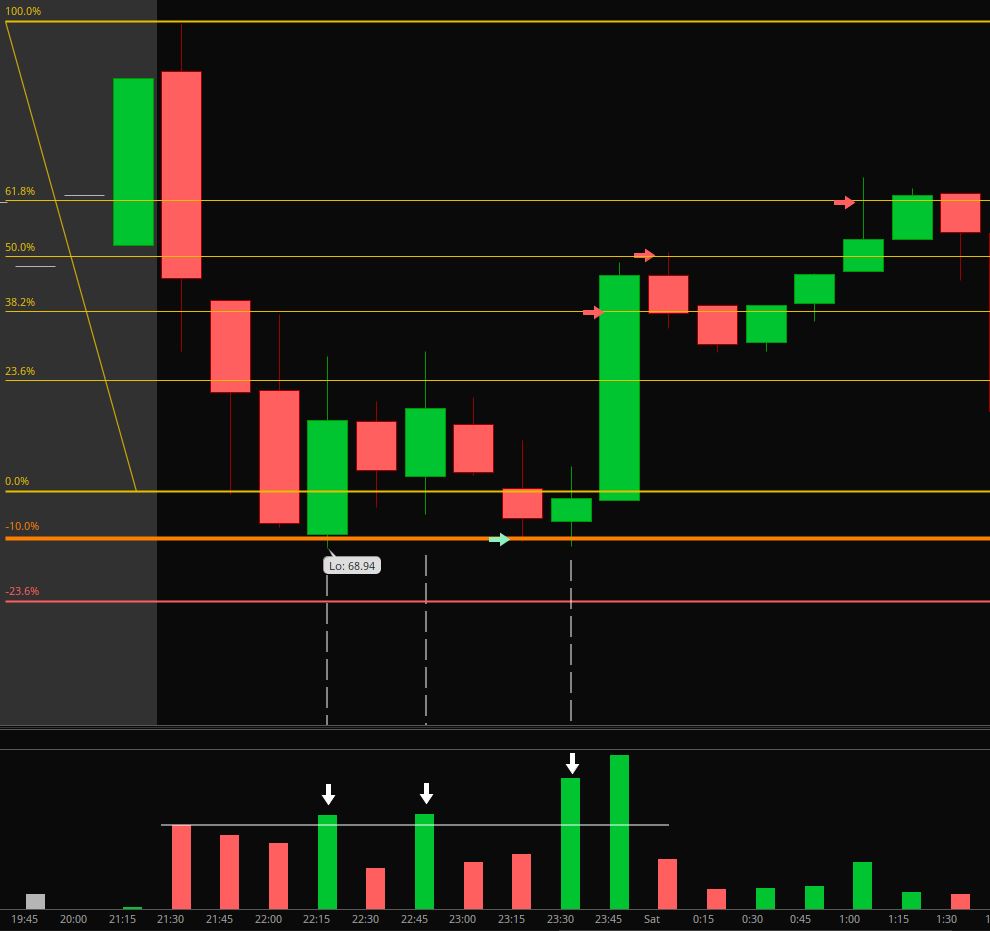
The market tends to experience a reversal period around 10:00 AM EST. This is quite hard to catch but here are some pointers that indicate a stock is showing signs of reversal. We draw a Fibonacci retracement from ORH to ORL once again. We add -10% and -23.6% levels to the Fibonacci retracement. First, we must see strong bounce at the -10% retracement level with high volume coming in pushing the price up. If this is valid, we can wait for retest of that level to enter calls, with stop-loss at a close below -23.6% retracement level. We trim our position by taking profit at every Fibonacci level (38.2%, 50%, 61.8%). As the price goes over each level, set a limit stop order at the previous level just like how we do it for ORB.
- Things to note:
This systematic trading works better for large cap stocks which are my main focus for options trading intraday.
Find a list up to 20 stocks that are forming patterns in daily chart and look ready for a big move. Cycle through this list during the premarket.
If you cannot find a good setup, you do not need to force a trade. Wait for it or take a rest day.
The above mentioned are textbook examples. Backtest the strategies on different stocks and get a feel of different scenarios to prepare yourself for trading in real time.
Like any other systems, this is not a guaranteed 100% get rich quick system. However, by practising and experimenting with this, it is possible to make consistent profits like I do.
Always respect the stop-loss and do not try to HOPE for the best. When the price goes your way, take profits. When it does not, take the loss.
We don't trade based on certainty, but probability. This is a risk management game.
This is for educational purposes only, you are responsible for your own trades. If you need help understanding, feel free to ask me any questions. I wish you success!
$Facebook(FB)$ $Apple(AAPL)$ $Amazon.com(AMZN)$ $Netflix(NFLX)$ $Alphabet(GOOG)$ $Microsoft(MSFT)$ $Tesla Motors(TSLA)$ $NVIDIA Corp(NVDA)$ $AMD(AMD)$ $PayPal(PYPL)$ $Twitter(TWTR)$ $Autodesk(ADSK)$ $NASDAQ-100 Index ETF(QQQ)$ $S&P500 ETF(SPY)$
Disclaimer: Investing carries risk. This is not financial advice. The above content should not be regarded as an offer, recommendation, or solicitation on acquiring or disposing of any financial products, any associated discussions, comments, or posts by author or other users should not be considered as such either. It is solely for general information purpose only, which does not consider your own investment objectives, financial situations or needs. TTM assumes no responsibility or warranty for the accuracy and completeness of the information, investors should do their own research and may seek professional advice before investing.
$NASDAQ-100 Index ETF(QQQ)$
30min ORB if you took this trade remember to trim your position at fib levels [财迷]