$DIS: Have you seen the forecast for The Walt Disney Company?
24-Hour Movement
The graph below gives you a visual look at DIS’s recent movement. We will get into why these numbers matter below, and get in more detail through out the article. For now enjoy the graph we have created for you.
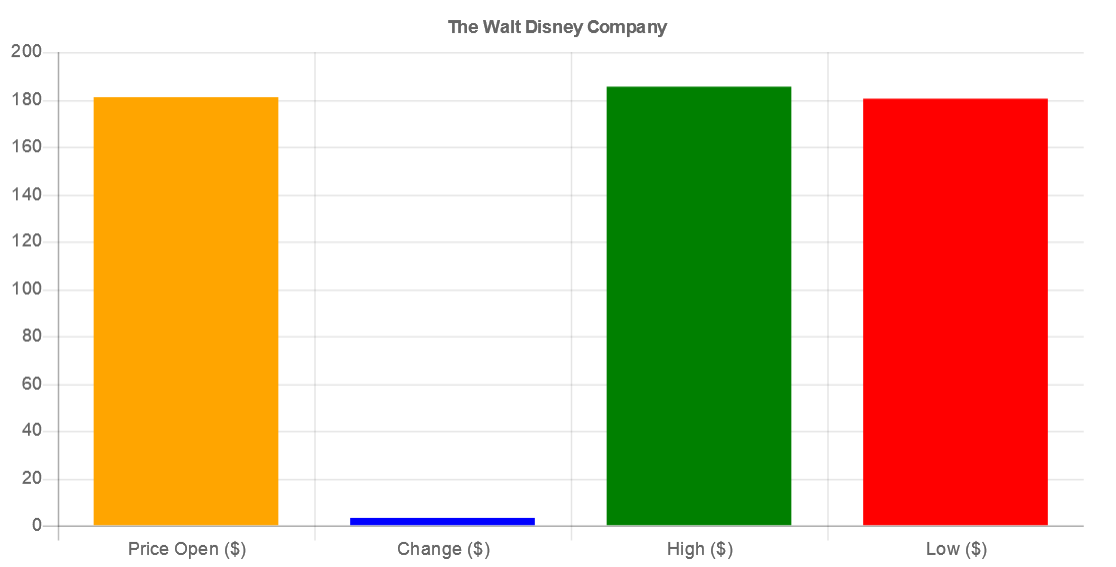
- Price Open: The price as of market open.
- Change: The price change since the previous trading day’s close.
- High: The current day’s high price.
- Low: The current day’s low price.
Market data
In this article, we will be analyzing The Walt Disney Company. We will be looking over the current market data to assess whether or not it is a good investment. To get started, the stock opened this morning at $181.02 and has moved $3.34 from yesterday’s closing price of $181. The high for today is $185.55 and the low is $180.05. A great indicator of where a stock is trending is by looking at its 52-week high/low. This is a technical indicator used by some traders and investors who view these figures as an important factor in the analysis of a stock’s current value and as a predictor of its future price movement.
The 52-week high for The Walt Disney Company is $203.02 and the low is $117.23. We will be moving onto the number of outstanding shares. One is that you can use shares outstanding to calculate the market capitalization, the total value, of a corporation. Multiply the price of a single stock by the number of shares outstanding to find a business’s market capitalization. The number of outstanding shares for The Walt Disney Company is 1817127000. Now that you know more about The Walt Disney Company stands, let’s learn more about the future of the company.
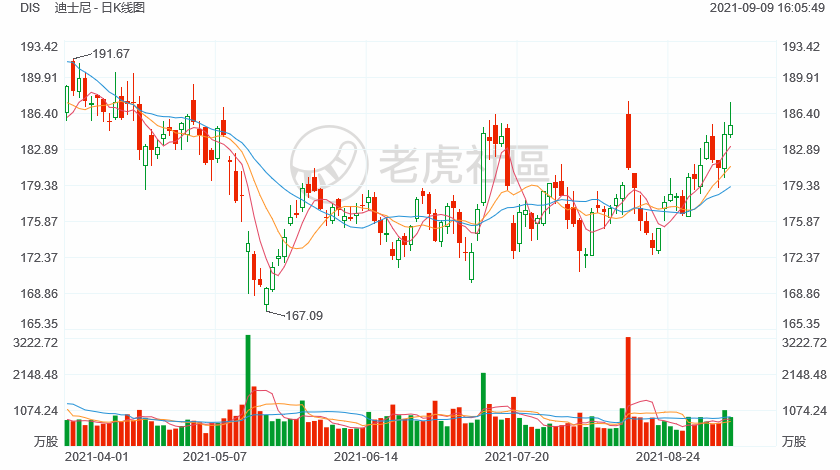
Stock chart
Stock analysis is a method for investors and traders to make buying and selling decisions. Investors and traders try to gain an edge in the markets by making informed decisions through analyzing the past and current data. The ultimate goal is to arrive at a number that can be compared to the present price of a security to determine whether it is undervalued or overvalued. View the chart below to get a better understanding of how the stock has been moving.
Disclaimer: Investing carries risk. This is not financial advice. The above content should not be regarded as an offer, recommendation, or solicitation on acquiring or disposing of any financial products, any associated discussions, comments, or posts by author or other users should not be considered as such either. It is solely for general information purpose only, which does not consider your own investment objectives, financial situations or needs. TTM assumes no responsibility or warranty for the accuracy and completeness of the information, investors should do their own research and may seek professional advice before investing.
