Better Buy: CapitaLand Integrated Commercial Trust Vs Mapletree Commercial Trust
We compare the two commercial REITs to determine which is the more attractive investment option.
Things are looking up for office REITs. The Singapore government recently announced a relaxation of COVID-19 restrictions that will allow up to 75% of staff to return to their offices. This is up from 50% before 29 March.
Larger gatherings of up to 10 people are also allowed to dine in, thereby helping to encourage face-to-face meetings among colleagues.
While telecommuting is still a popular option for many businesses that have successfully pivoted during the last two years, the option to return to the office means that landlords should see higher office occupancies in the coming months.
We decided to compare two REITs with both retail and commercial properties to see how they stack up against each other.
They are —CapitaLand Integrated Commercial Trust$CapLand IntCom T(C38U.SI)$ (SGX: C38U), or CICT, andMapletree Commercial Trust$MAPLETREE COMMERCIAL TRUST(N2IU.SI)$ (SGX: N2IU), or MCT.
Portfolio composition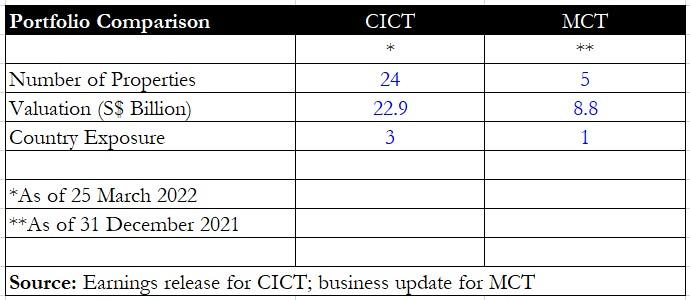
First, we looked at the portfolio composition for both REITs.
CICT has nearly five times the number of properties that MCT has, and the valuation of these properties is also almost triple that of the latter.
In terms of country exposure, CICT has properties in three countries — Singapore, Germany, and Australia, while MCT only has properties in Singapore.
However, MCT has proposed amergerwith Mapletree North Asia Commercial Trust$MAPLETREE NORTH ASIA COMM TR(RW0U.SI)$ (SGX: RW0U) in a S$4.2 billion deal.
After this merger, the new entity, Mapletree Pan-Asia Commercial Trust$MPACT(MPPTF)$ (MPACT), will own a total of 18 properties spread across four countries — Singapore, China, Hong Kong SAR, Japan, and South Korea valued at an estimated S$17.1 billion.
CICT, on the other hand, has also engaged in acquisitions in FY2022 that will increase the number of properties in its portfolio to 26 with a total valuation of S$24.2 billion.
Winner: CICT
Financials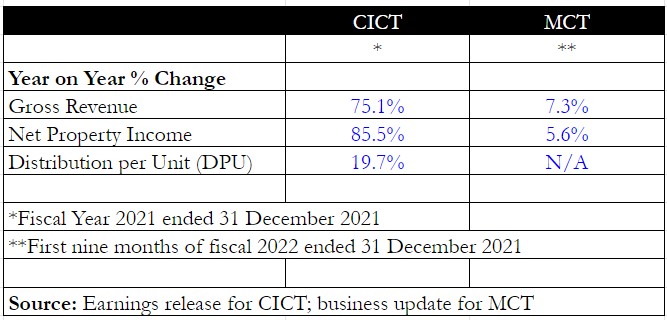
Next, we look at the financials for each REIT.
CICT reported a 75.1% year on year surge in gross revenue and an 85.5% year on year jump in net property income.
The reason for the sharp improvement was because of themergerbetween CapitaLand Mall Trust and CapitaLand Commercial Trust.
Also, CICT’s fiscal year-end is 31 December while MCT’s is 31 March; hence there is no DPU information for the first nine months of fiscal 2022 for the latter.
The financial numbers are thus not comparable.
Debt indicators
Things get interesting when we look at the next section on debt indicators.
Both REITs have nearly the same cost of debt at around 2.3% to 2.4%, but MCT has a slightly higher interest coverage ratio of 4.8 times.
MCT’s gearing level is also lower at 34.1%. Do note, however, that MPACT’s gearing will stand at 39.2% if the merger goes through successfully.
For CICT, itsrecent acquisitionof a Grade A office building at 79 Robinson Road will raise its aggregate leverage to around 41%.
Winner: MCT
Operating metrics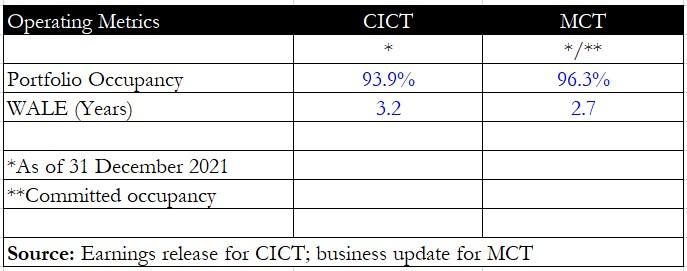
The fourth area we looked at was operating metrics, namely portfolio occupancy and weighted average lease expiry (WALE).
MCT had a higher committed occupancy of 96.3% as of 31 December 2021, compared with CICT’s occupancy level of 93.9%.
If we drill down further into the retail and commercial components, MCT also does a little better.
Its retail portfolio (i.e. VivoCity) enjoyed 98.9% committed occupancy while CICT’s retail division saw occupancy of 96.8%.
CICT’s office occupancy stood at 91.5% while three of MCT’s office assets enjoyed more than 95% committed occupancy. Only one asset (mTower) had an occupancy level of 87.6%.
However, MCT had a slightly lower WALE compared with CICT due to the larger contribution of its retail component.
Winner: MCT
Dividend yield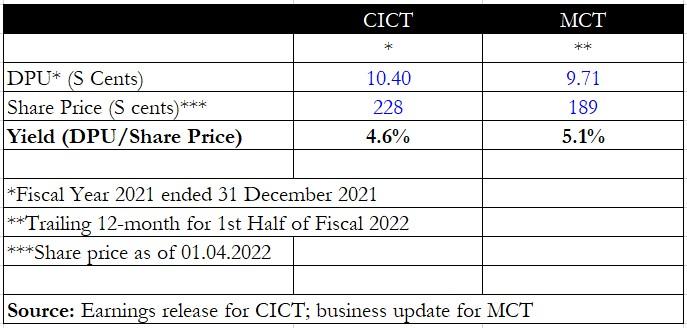
Finally, we get to the section thatincome investorscan appreciate – the distribution per unit (DPU) cumdividendyield.
CICT’s distribution yield stands at 4.6% while MCT sports a trailing 12-month distribution yield of 5.1%.
CICT’s DPU is poised to rise to S$0.1056 after it completes its acquisition of 79 Robinson Road along with its recent Australian acquisitions.
Even with the higher DPU, the trailing distribution yield remains at 4.6%.
MPACT’s DPU for the first half of fiscal 2022 is expected to rise from S$0.0439 to S$0.0478.
Factoring this higher DPU into the equation, MCT’s trailing distribution yield will rise from 5.1% to 5.3%.
Winner: MCT
Get Smart: MCT’s merger will be a game-changer
It’s clear that MCT has won on many aspects above, and if the merger with its sister REIT goes through, the numbers are going to look even more attractive.
That said, CICT is also working hard to increase its DPU and asset base with its recent acquisitions.
Although MCT may have won this round, CICT is not far behind in improving many of its metrics.
Is now a good time to buy into Singapore REITs? After all, almost 50% of the 44 Singapore REITs were trading close to their 52-week lows in January.
But with the right strategy, mindset and stocks, REITs can still be a powerful source of dividends today and in the years ahead.
Disclaimer: Investing carries risk. This is not financial advice. The above content should not be regarded as an offer, recommendation, or solicitation on acquiring or disposing of any financial products, any associated discussions, comments, or posts by author or other users should not be considered as such either. It is solely for general information purpose only, which does not consider your own investment objectives, financial situations or needs. TTM assumes no responsibility or warranty for the accuracy and completeness of the information, investors should do their own research and may seek professional advice before investing.
Nicely done comparison if you're considering between $CapLand IntCom T(C38U.SI)$ and $MAPLETREE COMMERCIAL TRUST(N2IU.SI)$ [Like]