Charts| Hot Stocks performance - BYRN,BHF,BAX,AYX,APO,AIRC&ACB
Hello, everybody.
Today I looked at these stocks and offered my insights: $Byrna Technologies Inc.(BYRN)$ $Brighthouse Financial Inc(BHF)$ $Baxter(BAX)$ $Alteryx Inc.(AYX)$ $Apollo Global Management LLC(APO)$ $Apartment Income REIT Corp(AIRC)$ $Aurora Cannabis Inc(ACB)$
1.BYRN$Byrna Technologies Inc.(BYRN)$ - Sharp Up Channel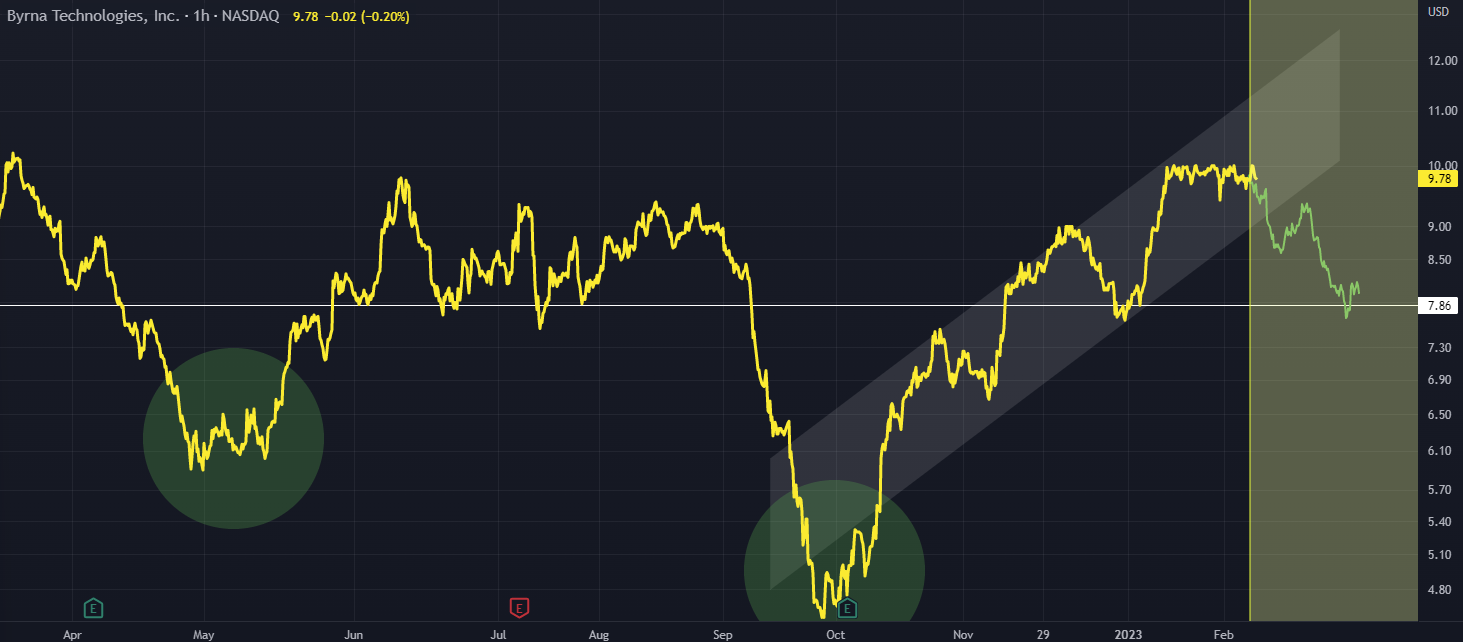
The up channel is very sharp, because of this I expect it to break down and return to the horizontal support line
The green circles paint a larger picture of a left shoulder and head formation with a right shoulder yet to be seen
Hourly chart
2.BHF$Brighthouse Financial Inc(BHF)$ - Bull Angle
Drawing trend lines allows this structure to form
Within this structure is a smaller channel up, I want this to break out to the upside strongly, potentially out of its channel contained in and touch the uppertrend line
If the uppertrend lineis touched it would be a big move
Bars pattern as usual for the example price movement
3.BAX$Baxter(BAX)$ - Update
Update for BAX, this is a simple analysis showing a long term upward channel
I have put the price tag on where people should enter for long based on this channel
Buy the dip scenario
4.AYX$Alteryx Inc.(AYX)$ - Another Rejection?
Middle point of the structure is again along the vertical line
When price touches upper line of the descending megaphone a rejection may occur completing the structure
I have tried to show this rejection with the bars pattern tool
Daily timeframe
5.APO$Apollo Global Management LLC(APO)$ - Megaphone Up
An up megaphone structure
Expect bullish continuation as price rebounds of the lower band of the megaphone
BULLISH
6.AIRC$Apartment Income REIT Corp(AIRC)$ - Outcomes
First bullish scenario shows a inverted H&S pattern with the vertical line being the head structure of thehead and shoulders
Second bear scenario shows a continuation of abearish channelthat can be seen on chart
This is thedaily chartfor AIRC
7.ACB$Aurora Cannabis Inc(ACB)$ - Large Falling Wedge
An idea showing a largefalling wedgewith an accompanying breakout in green bars pattern.
This is the daily chart.
The down trend could also be interpreted as adown channelif you sketched it a bit differently, but I prefer afalling wedgefor thebullishresult
https://www.tradingview.com/chart/ACB/u0RJqMPM-ACB-Large-Falling-Wedge/
Disclaimer: Investing carries risk. This is not financial advice. The above content should not be regarded as an offer, recommendation, or solicitation on acquiring or disposing of any financial products, any associated discussions, comments, or posts by author or other users should not be considered as such either. It is solely for general information purpose only, which does not consider your own investment objectives, financial situations or needs. TTM assumes no responsibility or warranty for the accuracy and completeness of the information, investors should do their own research and may seek professional advice before investing.
👍