Is Stock Cheap or Expensive? Earnings Insights on Q3
Q3 U.S. stock market status
(i) Valuation
1. Overall
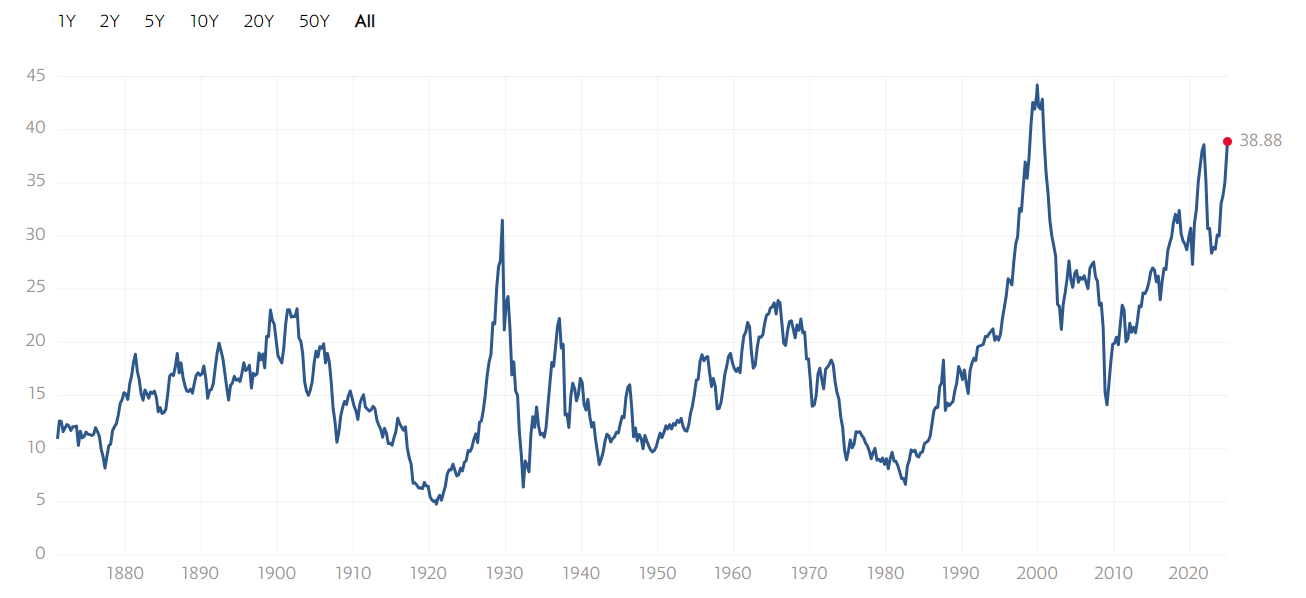
Currently, U.S. stock valuations are at high levels, with $.SPX(.SPX)$ index valued at the 94% historical quartile (Shiller PE) since 1990. According to $Goldman Sachs(GS)$ Group strategists, despite the rise in U.S. stock valuations across the board, historically high valuations alone have not been enough of a cause for immediate concern, and higher valuations are usually benign if the subsequent economic growth environment is healthy.
2. Valuation Differences by Index
Growth style $.IXIC(.IXIC)$ valuation is high but earnings support is strong. $NASDAQ 100(NDX)$ has risen to all-time highs, and the $Nasdaq 100 ETF (QQQ)$ is at a new all-time high.Technology "Big Seven" P/E ratios are much higher than the rest of the S&P 500, but comparing the index P/E ratios to the return on equity of the "Big Seven" reveals that while these companies are more expensive, their return on equity is also higher, and the overall valuation and U.S. stock valuations are still reasonable.The overall valuation and U.S. stock valuations are still reasonable.
3. Sector valuation characteristics
The U.S. technology "Big Seven" are a self-contained asset class that has resulted in distorted valuation metrics, but there are still investment opportunities in some of these companies, in addition to the mega-technology stocks.Investors should pay more attention to whether these seven companies can maintain their profitability and efficiency levels.
(ii) Market Performance
1. Trend of major indices
U.S. stocks hit record highs, with the Nasdaq 100 Index rising to an all-time high and the Nasdaq ETF hitting a new high since its listing.
2. Differences in industry performance
Q3 U.S. stock earnings overall slowdown, cyclical industry is the main drag, technology industry is still resilient, but structurally switched from hardware to software.
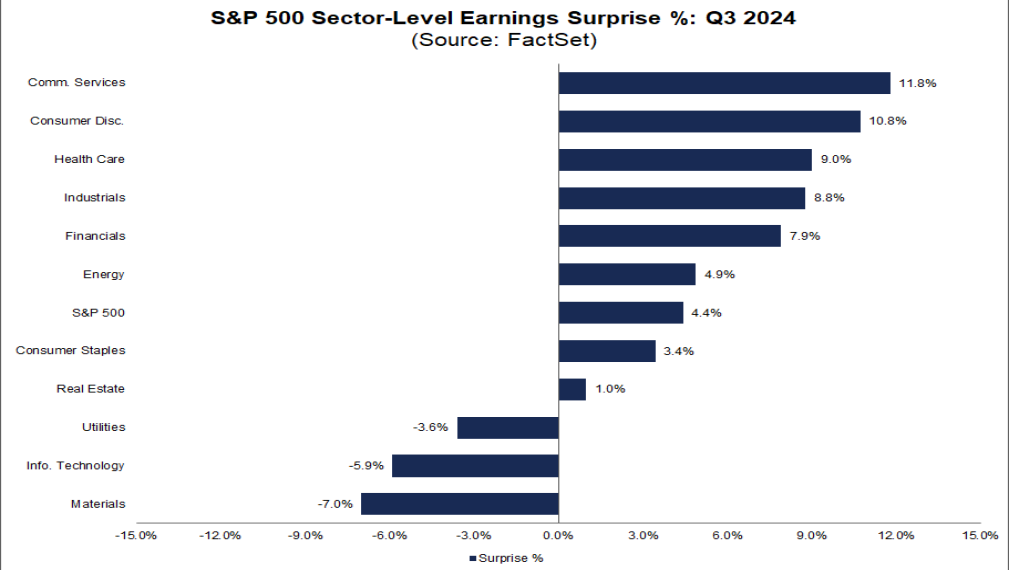
Earnings contribution, in the S&P 500 industries, communication services, information technology contributed about 70% of the S&P 500 index EPS (earnings per share) year-on-year growth rate, compared with 38% in the second quarter appeared to improve significantly.
Further dismantling of revenue sources found that AI drive cloud computing revenue and earnings growth have increased.
$Alphabet(GOOG)$ Cloud GCP, $Microsoft(MSFT)$ Intelligent Cloud, $Amazon.com(AMZN)$ AWS three-quarter revenue of $ 11.4 billion,38.9 billion, $27.5 billion, year-on-year growth of 35%, 22%, 19%, revenue growth rate are higher than the second quarter.
Q3 Earnings analysis
(I) Q3 Earnings
1. Overall earnings growth slowed
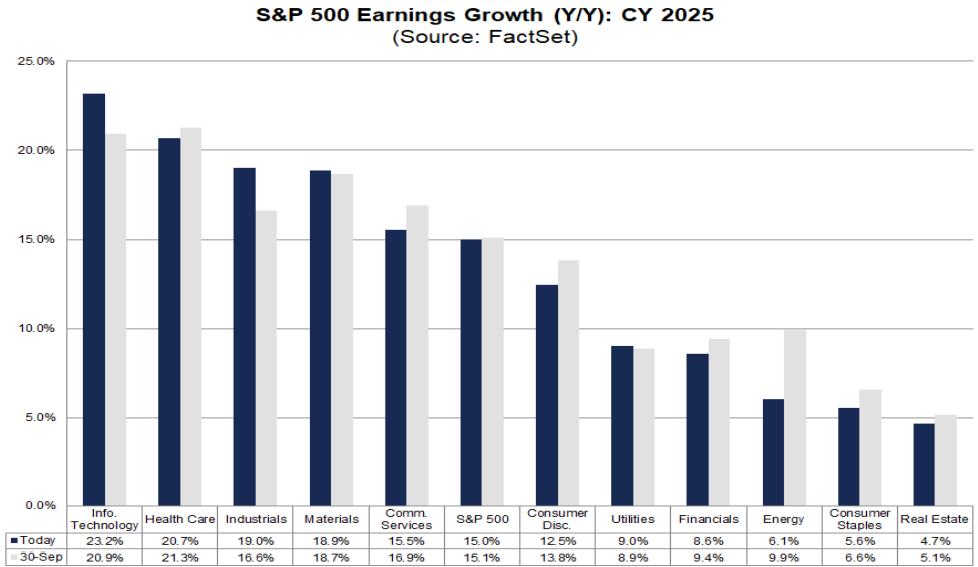
S&P 500 earnings growth slowed in the third quarter.Under the comparable caliber, the S&P 500 EPS grew by 5.5% in the third quarter, down significantly from 11.7% in the second quarter.In contrast, the growth style NASDAQ EPS rose to 19% from 13% in the second quarter, showing the difference in earnings growth between different indexes.
2. Cyclical Sector Earnings Decline
Cyclical sectors such as energy, financials, utilities, and industrials saw their year-on-year growth rates and earnings contributions fall in the third quarter.
Specifically, the energy sector growth rate fell to -18.4% from 7.7% in the second quarter;
Financials declined to 6.7% from 18%; Utilities declined to 5.5% from 16%;
Industrials fell from -3% to -11%.
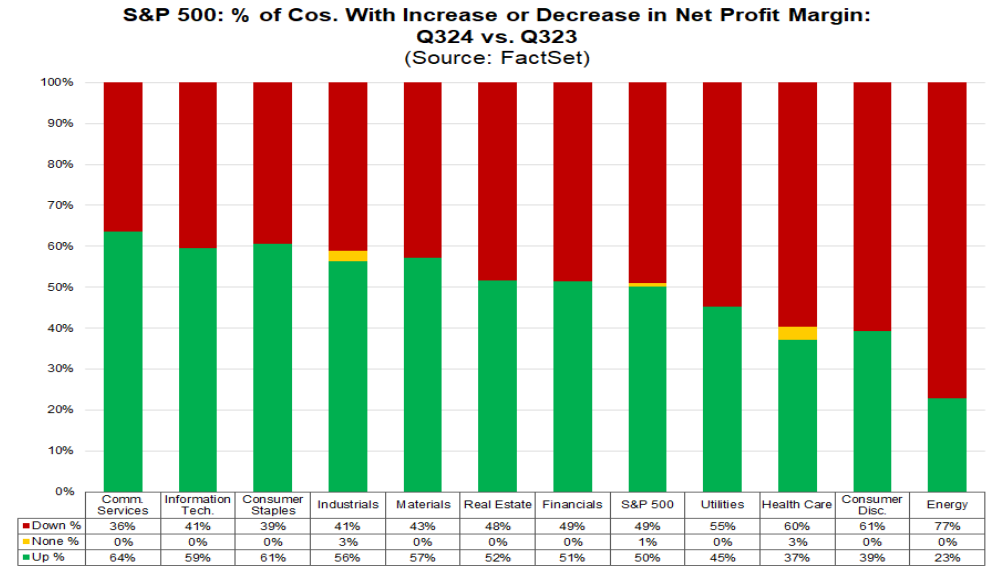
In terms of earnings growth contribution, cyclical sectors such as Energy, Industrials, and Raw Materials together dragged down earnings by nearly 40%, while Financials' contribution declined from 31% to 24%.
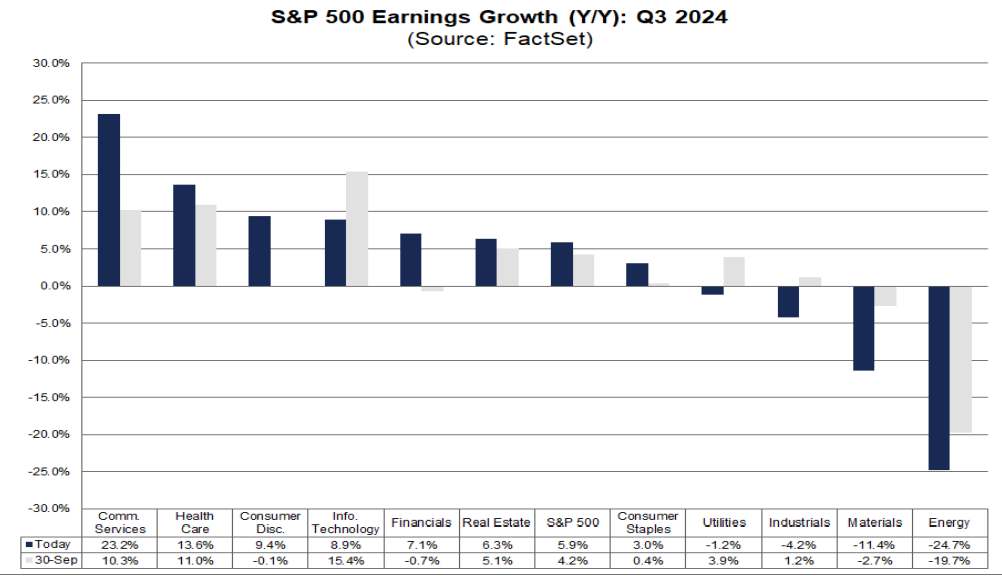
The Technology sector remained resilient in terms of growth and contribution in the third quarter, but the internal structure changed, with "software" outperforming "hardware".
Media & Entertainment's year-over-year growth rate turned sharply positive, rising to 29.3% in the third quarter from - 8.1% in the second quarter, while Software & Services continued to lift, rising to 11% from 8.7% in the second quarter.However, semiconductors and equipment and technology hardware continued to decline, from 57.7% and 7.2% in the second quarter to 38.8% and -22.5%, respectively.
1. Impact of the general economic environment
U.S. stock earnings, especially the cyclical sector, which is strongly correlated to the economy, retreated, reflecting the overall economic slowdown in the third quarter.
The slowdown in the U.S. economy at that time, with manufacturing PMIs remaining in contractionary territory and employment data weakening, coupled with extreme weather disturbances such as hurricanes and recessionary fears resulting from elevated unemployment triggering the "SAM Rule", affected consumer confidence and even corporate production activity.
However, the market has clearly begun to "look forward". On the one hand, the opening of interest rate cuts has helped to repair interest rate-sensitive segments of the economy, such as real estate and business investment; on the other hand, Trump's victory in the election has rekindled the market's expectations for a series of expansionary policies after his election.
2. Technology sector restructuring
The slowdown in tech sector growth in Q3 was not a "falsification" of the overall trend, but more of a structural change.This was reflected in the "hardware" falling back from a high base, while the "software" sector filled the "gap".
Growth in the previously stellar Semiconductor & Equipment sector slowed but still maintained double-digit growth, in part due to an overly high base, while the Technology Hardware sector was dragged down by the major weighting of Apple.In contrast, media and entertainment and software services earnings growth is still lifting.
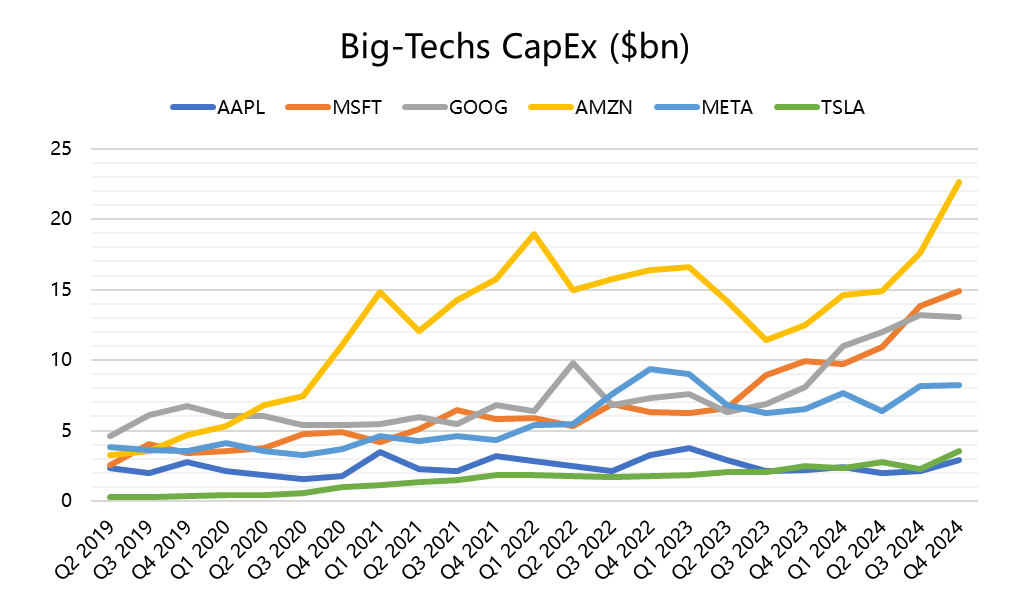
In addition, the abundant cash flow of technology companies also continued to support their buyback and capital expenditure activities. The capital expenditure of the seven leading technology stocks continued to grow at a high rate in the third quarter, rising to 59% from 52% in the second quarter, and contributed 24% of the overall capital expenditure of the S&P 500 non-financial companies.
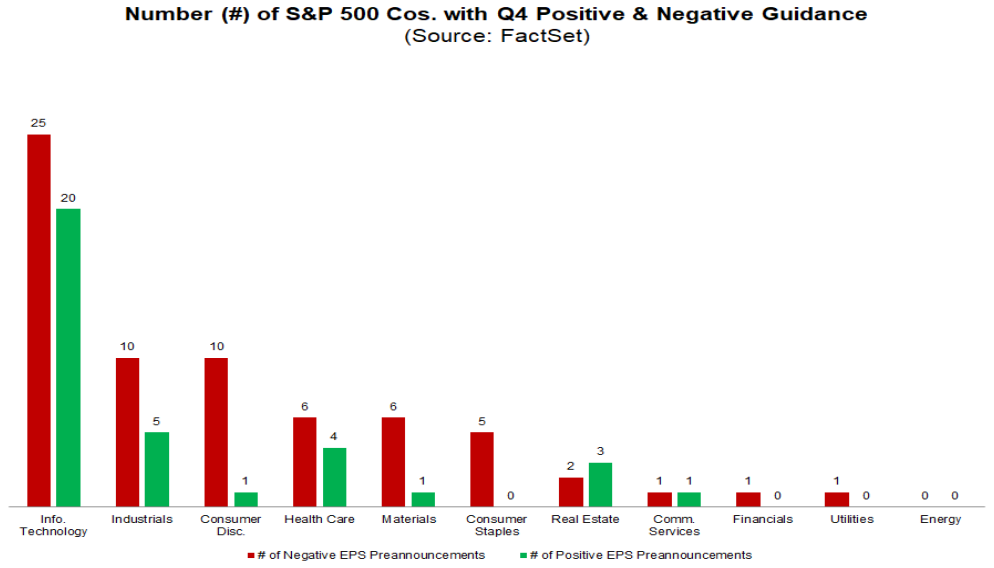
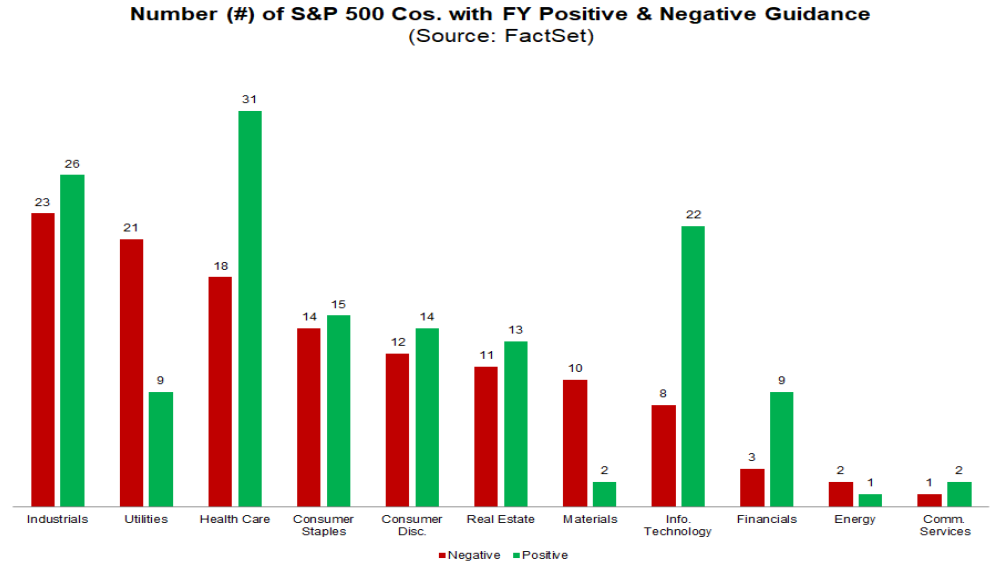
3. Relatively Healthy Guidance
III. U.S. Stocks Upside Forecast
(i) Market space measurement
1. Earnings growth expectations
Combining the U.S.'s own growth path and expectations for overseas revenue growth, U.S. stocks are expected to grow earnings at a rate of 10 percent in 2025, slightly higher than this year's 9 percent.This forecast is based on the following considerations:
On one hand, the U.S. economy is expected to gradually stabilize and repair by mid-2025, providing a favorable macro environment for corporate earnings;
On the other hand, overseas revenue growth is also expected to support U.S. earnings growth, with overseas revenue expected to grow by 30%-40%.
In addition, AI industry trends remain optimistic with high profit margins, which will further boost US earnings growth.Meanwhile, Trump's tax reform is expected to boost U.S. earnings by 3-4 percentage points, although whether it will be reflected in 2025 earnings depends on the progress of the policy.
2. Limited valuation expansion
Under the current path of inflation and interest rate cuts, a reasonable pivot for 10-year US bond rates is expected to be around 3.8%-4%.Risk premiums are already in the 28% historical quartile since 1990, with relatively limited room for further decline and possibly even contraction under certain circumstances.Therefore, there is limited room for further valuation expansion.According to CICC's estimation, the dynamic valuation may drop slightly to around 21. Combined with the above assumption of 10% earnings growth, the S&P 500 Index is expected to be at 6300-6400 in the baseline scenario, and at 5700-5900 in the pessimistic scenario.
(ii) Factors affecting the upside
1. Pro-cyclical sector resilience
Pro-cyclical sectors such as financials, energy, real estate and investment will benefit in several ways.
First, in the natural repair cycle of the economy, the growth momentum may appear "new" and "old" switch, interest rate sensitive real estate and investment may take the lead in the repair, but the intensity will not be too large.Measured nominal investment ring-fold annual growth rate from the current 5.9% slightly increased to 8.7% in the third quarter of 2025, the incremental real estate sales are dominated by new homes, lifted by 6% year-on-year to about 75 - 800,000 units.
Secondly, many policies advocated by Trump also benefit more from pro-cyclical sectors, such as tax cuts, financial, energy, transportation, the effective tax rate is higher, so the benefit is more elastic; interest rate cuts near the end of the cycle and the financial de-regulation advocated by the latter Secretary of the Treasury, Bessert, directly benefited from the financial sector; Trump liberalization of oil and gas exploration will help oil and gas investment.
Industrial giant $Honeywell(HON)$ suggests that although it remains cautious about sales growth in the short term, the company expects growth rates to repair and margins to start expanding in 2025; Caterpillar expects to continue to benefit from government infrastructure projects, while demand in the power generation sector is expected to remain strong, boosted by the AI industry.
2. Technology industry trends
Technology industry trend is still the main line, focusing on whether AI technology can be gradually converted into revenue, and whether the leading companies can continue to expand the scale of capital expenditure.
$Meta Platforms, Inc.(META)$ $Amazon.com(AMZN)$ $Alphabet(GOOGL)$ $Alphabet(GOOGL)$ have all indicated that AI-related cloud business, advertising revenue benefiting from AI technology achieved impressive growth in the third quarter.bright growth in the third quarter, and NVIDIA also said that "large-scale enterprise AI demand is still increasing", so the revenue side may still be resilient.
On the capex side, Amazon, Meta, Google and Microsoft all said they will continue to invest more in AI infrastructure, and Amazon emphasized that the scale will exceed 2024, but Google said its investment growth rate may slow down.
1. Short-term risks and pullbacks
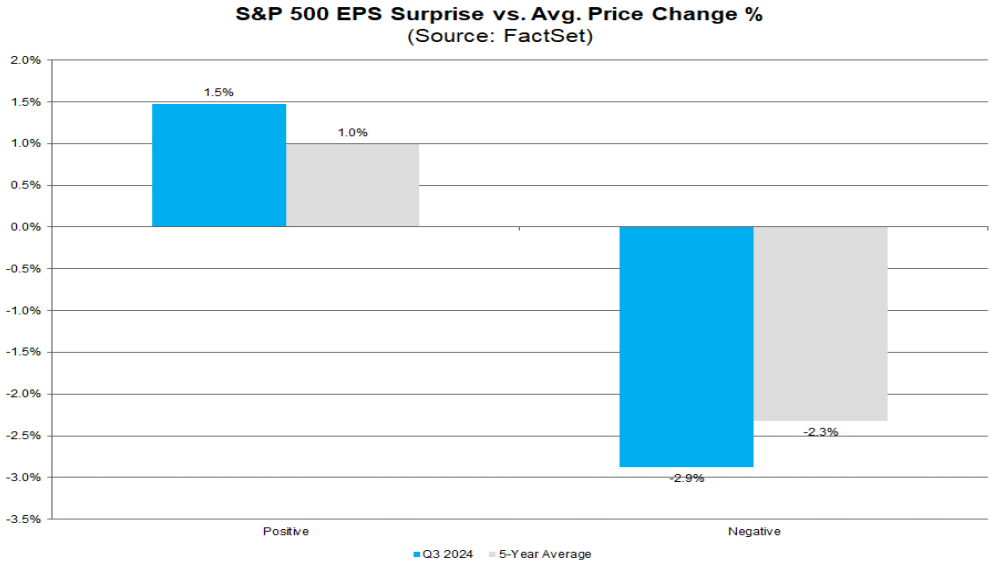
In the short term, with expectations continuing to mount, U.S. stock valuations are already at high levels, counting on more optimistic expectations, and technical indicators such as overbought conditions continue to heat up, so there is a risk of a partial "correction" in market sentiment in the future, if some of the data is less than expected or if Trump is elected to push forward with less than the expected order and extent of policies.
A few key nodes for:
Next week (December 11) whether November US inflation will influence expectations for a December rate cut;
Whether inflationary policies (e.g., tariffs and immigration) will greatly exceed expectations after Trump's inauguration on January 20, and whether growth policies will meet expectations (tax cuts, oil and gas supplies, etc.).
Mid-January also coincides with the opening of the fourth-quarter earnings period for U.S. stocks, the market is already more sensitive, if there is a less-than-expected scenario, it is possible to induce a certain pullback.
2. Opportunities after the pullback
Market pullbacks are not a bad thing; for one, over-exuberant sentiment needs to be digested in favor of a more sustainable rally, and for another, the long-term outlook is not pessimistic.The three "macro pillars" of U.S. stock strength over the past three years have been big finance, technology, and global capital rebalancing, enabled by "episodic" factors such as epidemics and tech AI outbreaks.
This is the same combination of strong growth, massive fiscal deficits and trade deficits ("twin deficits") during the Reagan years, but with a strong dollar maintained and continuous inflows of funds from overseas, forming a mutually reinforcing "Reagan cycle."Many of Trump's policies may reinforce or even solidify these three pillars, so as long as there is no directional reversal in these "three pillars," the trend in U.S. equities may not yet be disrupted.
Disclaimer: Investing carries risk. This is not financial advice. The above content should not be regarded as an offer, recommendation, or solicitation on acquiring or disposing of any financial products, any associated discussions, comments, or posts by author or other users should not be considered as such either. It is solely for general information purpose only, which does not consider your own investment objectives, financial situations or needs. TTM assumes no responsibility or warranty for the accuracy and completeness of the information, investors should do their own research and may seek professional advice before investing.
- NEXTTOME·12-09It's fascinating how valuations can appear high but still support growth.LikeReport
- MoiraHorace·12-09Your analysis highlights the complexity of current valuations.LikeReport

