$Penn Ent(PENN)$
The daily chart for Penn Ent shows a developing inverse head and shoulders pattern, a classic bullish reversal indicator, highlighted by the orange arcs. The stock is currently testing neckline resistance while breaking above its 20-day and 50-day EMAs. If it can sustain a breakout above this neckline and conquer the 200-day EMA resistance (around $15.55) on strong volume, it implies a potential trend reversal from bearish to bullish, signaling higher prices ahead.
@Tiger_comments @TigerObserver @TigerPicks @TigerStars @Daily_Discussion 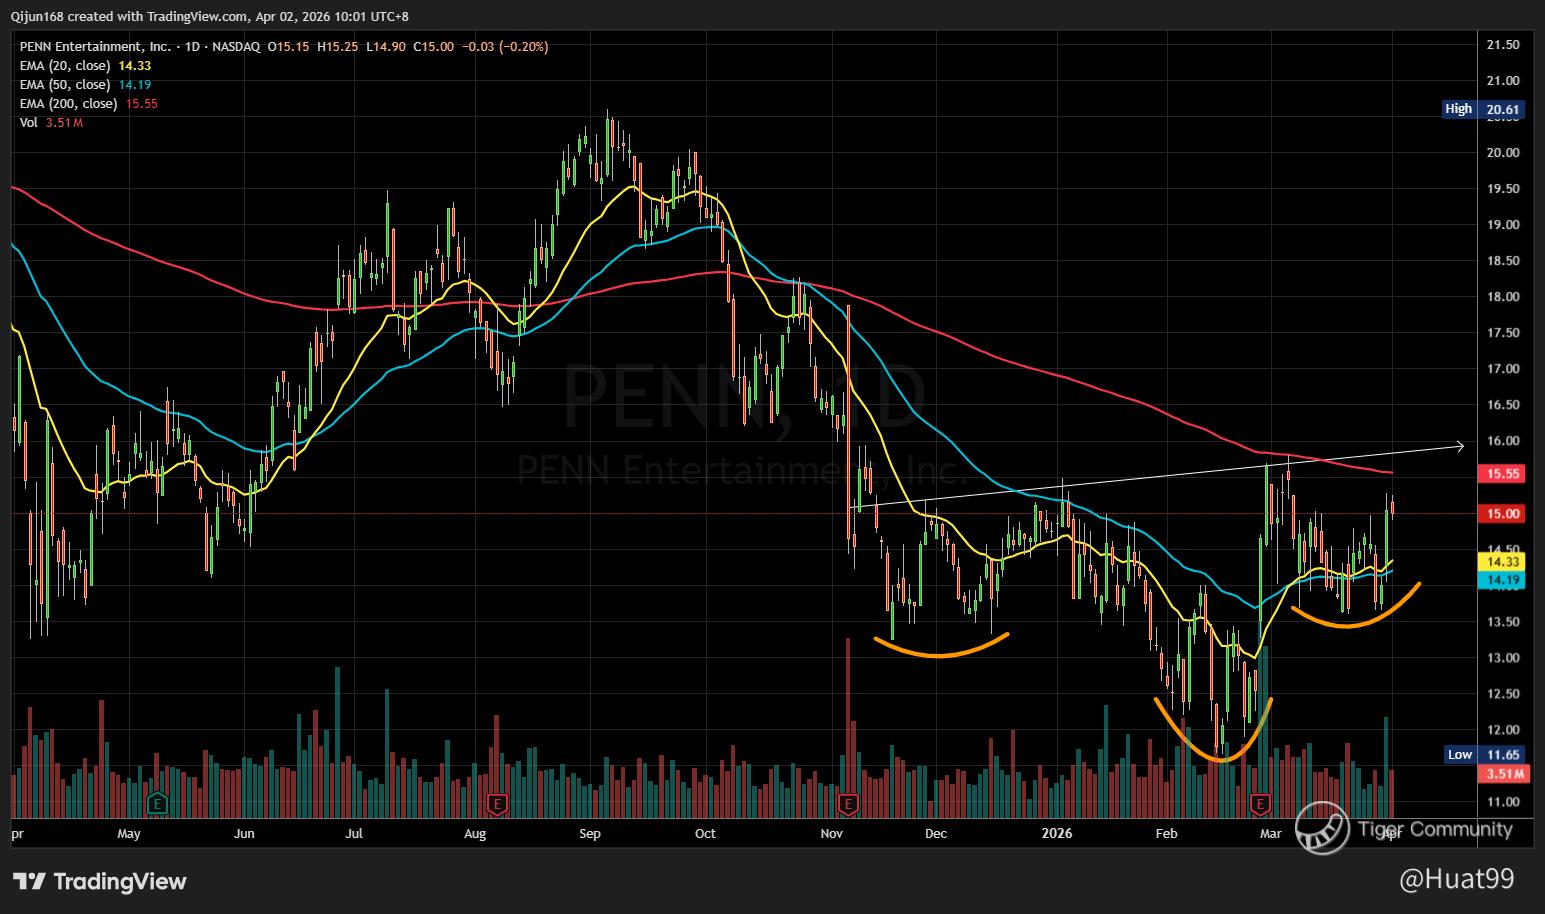
Disclaimer: Investing carries risk. This is not financial advice. The above content should not be regarded as an offer, recommendation, or solicitation on acquiring or disposing of any financial products, any associated discussions, comments, or posts by author or other users should not be considered as such either. It is solely for general information purpose only, which does not consider your own investment objectives, financial situations or needs. TTM assumes no responsibility or warranty for the accuracy and completeness of the information, investors should do their own research and may seek professional advice before investing.
Comments