The S&P 500 (SP500) ended 5.28% lower for Q3, final figures show, with the benchmark index ending in bear market territory for a second consecutive quarter. The SPDR S&P 500 Trust ETF also fell 5.32%. For the year so far, the ETF has lost -24.80%, putting it on track for its poorest yearly showing since 2008.
After ending Q2 with a ~16% fall for its worst showing in over two years, the S&P 500 (SP500) stabilized somewhat with a smaller loss for Q3. However, the U.S. Federal Reserve's aggressive fight against inflation - the central bank hiked rates for a fifth consecutive time in the quarter - have strengthened investor fears that it was committed to its path even at the cost of a healthy economy.
It was an eventful quarter for the benchmark index, with the S&P 500 (SP500) initially posting a ~9% jump in July, as strong corporate earnings helped investors overlook high inflation. The Fed at that time had suggested that rate hikes would become less aggressive as the inflation fight dragged on.
But consumer prices have stayed high, and the central bank responded with its third big rate hike in a row, signaling that it was committed to an aggressive approach. A strengthening U.S. dollar and turmoil in bond markets also added to the overall gloom. The S&P 500 (SP500) fell about 4% for August and then extended its losses with a ~9% drop in September.
Analysts expect the S&P 500 (SP500) to continue sinking, with Bank of America and RBC Capital Markets believing the index could fall to as low as 3,000 points. Goldman Sachs cut its year-end forecast for the index to 3,600 points, and anticipates it to end 2023 at 4,000 points in the case of a soft landing and 3,750 points in the case of a hard one.
9 of the 11 sectors in the S&P 500 (SP500) ended in the red for September, with both Real Estate and Communication Services shedding more than 10% each. Consumer Discretionary and Energy were the top gainers. See below a breakdown of the eleven sectors of the S&P 500 and their quarterly performance. Additionally, see how the accompanying SPDR Select Sector ETF performed from June 30 close to Sept. 30 close.
#1: Consumer Discretionary +4.13%, and the Consumer Discretionary Select Sector SPDR ETF (XLY) +3.62%.
#2: Energy +1.16%, and the Energy Select Sector SPDR ETF (XLE) +0.71%.
#3: Financials -3.62%, and the Financial Select Sector SPDR ETF (XLF) -3.47%.
#4: Industrials -5.12%, and the Industrial Select Sector SPDR ETF (XLI) -5.15%.
#5: Health Care -5.55%, and the Health Care Select Sector SPDR ETF (XLV) -5.56%.
#6: Information Technology -6.44%, and the Technology Select Sector SPDR ETF (XLK) -6.56%.
#7: Utilities -6.71%, and the Utilities Select Sector SPDR ETF (XLU) -6.59%.
#8: Consumer Staples -7.24%, and the Consumer Staples Select Sector SPDR ETF (XLP) -7.55%.
#9: Materials -7.64%, and the Materials Select Sector SPDR ETF (XLB) -7.60%.
#10: Real Estate -11.66%, and the Real Estate Select Sector SPDR ETF (XLRE) -11.87%.
#11: Communication Services -12.91%, and the Communication Services Select Sector SPDR Fund (XLC) -11.76%.
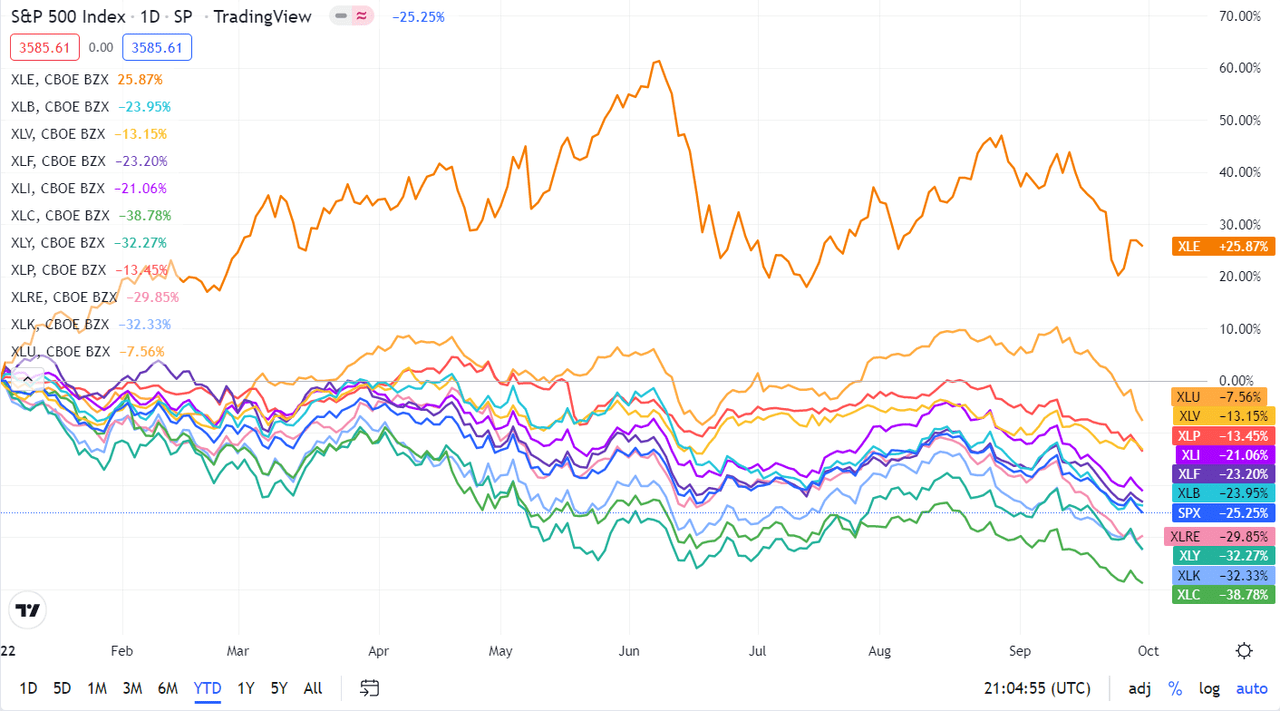
Below is a chart of the eleven sectors' year-to-date performance and how they have fared against the S&P 500.