Hao Hong | Outlook 2024: A Year of Normalization
$USD Index(USDindex.FOREX)$ $HSTECH(HSTECH)$ $HSI(HSI)$ $FTSE China Bull 3X Shares(YINN)$ $ProShares Ultra FTSE China 50(XPP)$ $CSI China Internet ETF(KWEB)$
Year two of normalization with similar trading range. The biggest normalization of 2023 is that China emerged from COVID. An extended period of seclusion naturally breeds confusion. But with improved communication, as evidenced by high-level exchanges between both sides and increased international traffic, foreign relationship should improve.
At the darkest hours of last October, we were the lone voice for optimism and forecasted that the Shanghai Composite should trade between ~3,000 and 3,500, while the Hang Seng should trade between ~16,000 and 23,000 in the following 12 months. The actual trading range was 2,924 to 3,419 for Shanghai, and 15,945 to 22,700 for Hang Seng. We look for an extension of this trading range in the coming 12 months.
CNY weakness/China-US yield gap at extremes and set to normalize. As the Fed tightens relentlessly while the PBOC eases to support the Chinese economy, the China-US yield gap has widened to its largest in history and is comparable to the level in early 2006. Such a wide and stable yield gap presents a carry trade opportunity for speculators, and weakens foreign confidence and investment return from Chinese assets.
Fortunately, the CNY REER has reached its cyclical lows, and the market is starting to price in four Fed cuts in 2024. As such, the historic weakness of the CNY should trough, while the yield gap should narrow. Such normalization should alleviate the pressure on fund flows and Chinese assets, and spur intermittent market rebounds and rallies.
PBOC sterilization to wane after strong liquidity growth; fiscal policies coming. The PBOC does not appear to be shortening its balance sheet, with higher foreign assets holdings and steady free reserves. This is not a balance sheet of heavy FX intervention, despite capital outflows. Strong deposit growth, or “excess saving”, is in tandem with China’s surplus in goods trade vs current account.
That said, property malaise will likely take a few years to heal, given the current inventory buildup. As such, deposits balance will unlikely be allocated systemically towards property or stocks, leaving an impression of an economy beset by weakness. In 2023 property statistics worsen further from 2022, with halved land sales, falling property investment and tepid sales growth. but China still manages 5% growth. It is likely to muddle through again in 2024.
As liquidity growth normalizes, fiscal policies will likely take over as a more important stabilizer of growth. Local government debt can be swapped for central government bonds, its maturity can be extended, and interest rate can be cut. For the embattled developers, they need to plan for an extended period with annual sales well under 10 trillion RMB, as the breakneck urbanization pace normalizes and demographic ages. These changes will create headline risks for the market, making any rebound more capricious to trade.
Three Rates Affecting
Investment Return in China
“Forecast is hard, especially when it is about the future”. – Niels Bohr
Last year when we penned our 2023 outlook, China was about to emerge from its COVID lockdown. As the virus ravaged across the country, the economy almost grinded to a halt. It was the darkest hour. We were among the courageous few who turned bullish at that juncture. Our forecast trading ranges for the next twelve months were 3,000-3,500 for the Shanghai Composite, and 16,000-23,000 for the Hang Seng.
As the year unfolded, the Shanghai composite traded between 2,924 and 3,419, while the Hang Seng traded between 15,945 and 22,700. It has been an extremely volatile year to trade, and we are only too glad to see our forecast range stand the test of these tumultuous times.
Even so, the year has left many unanswered questions. The most glaring one is that, despite many policies to support the economy and the market, the on-/off-shore market did not seem to be as responsive as they used to. Instead, the Chinese markets have been capricious. This is a year when even if one makes the right call but could still lose money. It is baffling.
To better forecast the coming twelve months, it requires us to probe into the root for this year’s market losses.
Figure 1: Chinese stock return = Exchange Rate + Valuation (Interest rate) + Earnings Growth Rate. 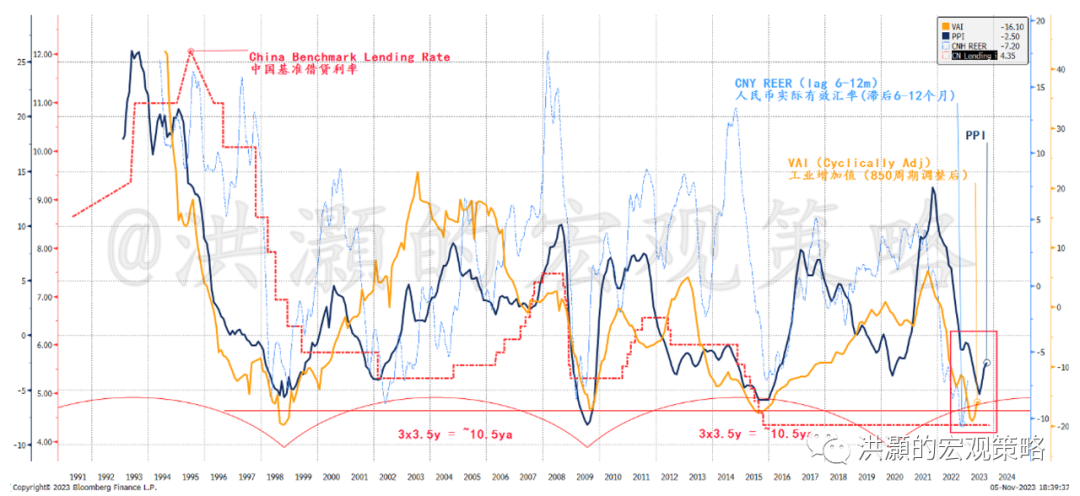
We can dissect investment return in China into three parts: 1) the currency component dictated by exchange rate; 2) valuation affected by interest rate; and 3) earnings growth rate. As we look into each component, we should see the effect of these components on investing in China this year and beyond (Figure 1).
CNY Weakness Abating
The drag of a weakening CNY on investment return in China is palpable, especially after the currency reform in August 2015 when China decided to let the market determine where the CNY should trade, and repegged the CNY to a basket of currencies afterwards.
In the past twelve months, the CNY initially strengthened to 6.7 soon after China re-opened, but then quickly succumbed to depreciation pressure as the U.S. bond yields started to surge. The widening yield gap between the US and China created a carry trade opportunity between the US and Chinese assets. One could borrow to short the CNY against the USD, then take the dollar to buy high-yielding US assets.
The PBOC must maintain an easy monetary policy to support the domestic economy, but intervene when the CNY is at around 7.3-7.4. As such, a steady carry can be earned. This trade is almost as good as the Yen carry trade, as its components are stable and the central banks’ reactions are predictable. Many private banks in Hong Kong offer clients this structured product.
We can compare the yield gap and benchmark interest rate differential between China and the US, and the carry trade return from the trade set up aforementioned, as well as the CNY (Figure 2). We can see that these rates are closely correlated. That said, as the yield gap has reached its highest in history, equivalent to that in early 2006, the carry appears to have peaked and rolled over. If so, the CNY, which appears to be at its weakest in recent years, will soon strengthen -- if history is a guide.
Figure 2: US-China interest rate differential explains the weak CNY and Chinese stocks. 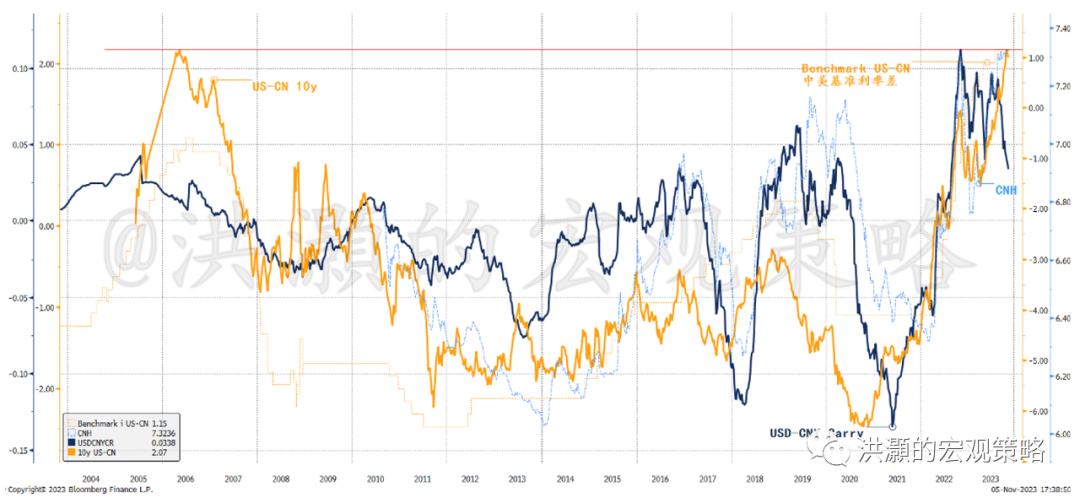
We can also demonstrate that the yield gap and the benchmark interest rate differential between the US and China are highly correlated with the relative performance of the two countries’ stock markets (Figure 3).
The US yields are calming down, due to an abating inflationary outlook, as well as a Fed that seems to have taken a dovish turn in its recent press conference. If so, the yield gap between the US and China should have peaked, even if the Fed will likely keep its interest rate “higher for longer” while the PBOC will stand ready to ease if necessary. As such, the US relative outperformance should pause, too.
Figure 3: China-US yield gap pressures Chinese stocks. 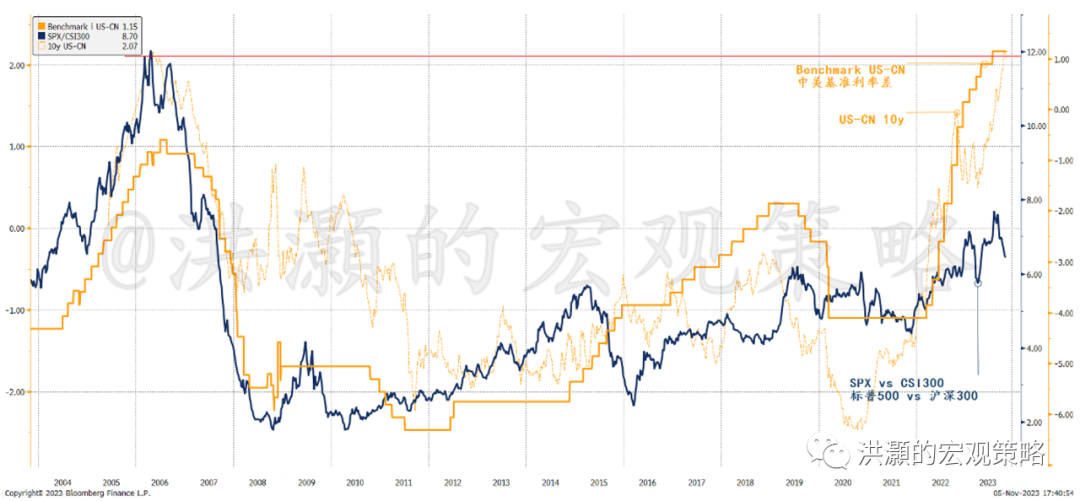
Concurrent with the carry trade that has been fecund in the past year, we are seeing the largest foreign outflow of equity and bond investment from China ever on record. It is not surprising, given that the currency component of the investment return from Chinese markets has depreciated so much in the past year, and has added volatility to the foreign investors’ portfolio.
In Figure 4, we demonstrate that the Shanghai Composite priced in USD has performed substantially worse than if priced in CNY. The underperformance has been particularly acute after 2022, and indeed has been aggravating. Such severe and predictable underperformance explains more why foreign investors are pulling out of the Chinese market, rather than the ideological difference that many have conveniently alluded to.
Indeed, we can show that foreign investment in Chinese bonds and equities has plunged to its nadir in late 2022. While the outflow seems to be abating around June when data were last reported, it is still substantially worse than the outflow seen in 2018 during the trade war.
Further, we note that the direction of the Shanghai Composite and the net foreign investment flows are closely correlated and diverging together from the PBOC balance sheet expansion (Figure 4). Simply put, worsening investment return from the Chinese market due to the depreciating CNY has induced foreign investment outflow. And so far, the PBOC’s monetary maneuvers have failed to lift the economy, but added to the CNY depreciation pressure instead.
Figure 4: Net foreign investment recovering but still negative & diverging from PBoC’s balance sheet.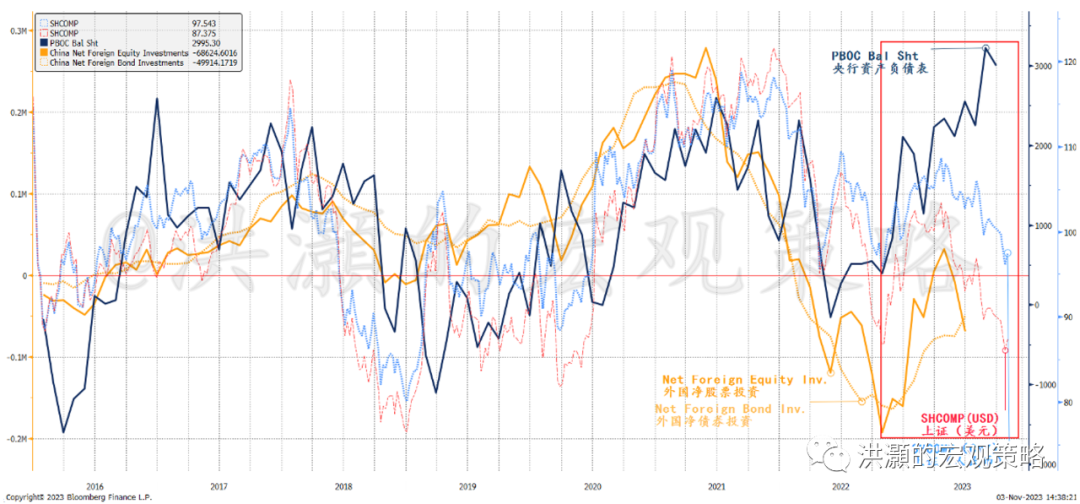
Many suspect that the PBOC has been manipulating the CNY exchange rate. After all, the Chinese trade balance has climbed to record, while China’s FX reserve has barely budged. It is natural to assume that China is spending its forex pile to support the currency.
However, we find that the PBOC’s position for FX purchase has not changed much, suggesting little intervention in the spot market. While CNY forward position had built up in the second half of 2022, these positions are largely held steady in 2023.
Meanwhile, net foreign asset holdings continue to accumulate on the PBOC’s balance sheet. Even though foreign liabilities have doubled in the past year, it is still relatively small part of the PBOC’s balance sheet.
As such, the PBOC’s balance sheet does not look like a central bank that has been actively and heavily intervening in the forex market to support the CNY. Otherwise, foreign assets holdings should shrink, as well as those free reserves on the liability side. That said, the PBOC has used some forward contracts to manage the pace of the CNY deprecation, but similar operations were seen during the 2015/16 episode after the currency reform (Figure 5).
Figure 5: Little strong evidence of heavy FX spot market intervention by the PBOC. 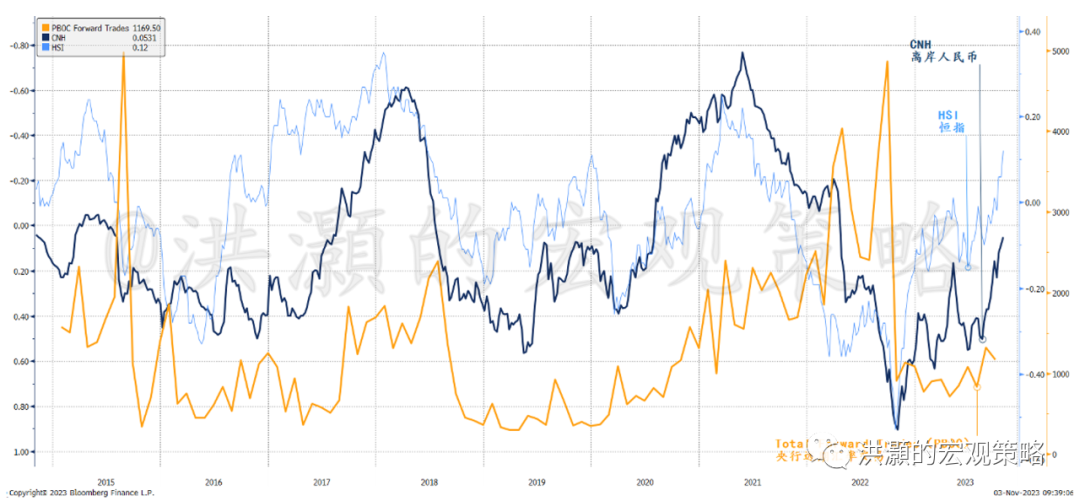
The CNY REER Has
Reached a Cyclical Bottom
There have been speculations about Russia settling its oil exports in CNY, but then selling the CNY for USD to replenish its USD reserve. There could be elements of truth in this conspiracy theory. After all, Figure 6 shows that China-Russia trade balance is closely correlated with oil price, the CNY, and the FX settlement deficit in the Chinese banks.
Figure 6: FX settlement deficit around all time low, & correlated with China/Russian Trade since 2018. 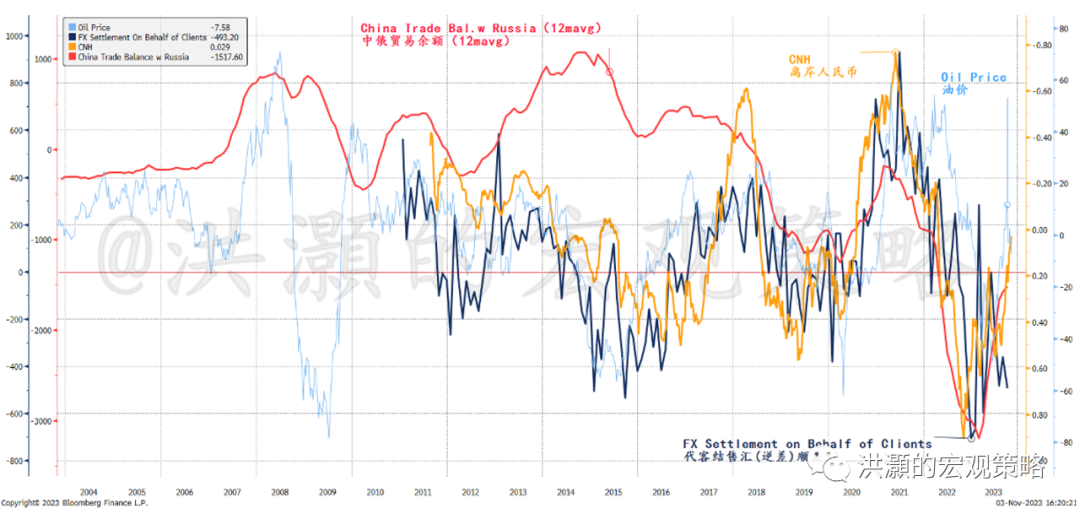
However, our research shows that China has only 16.3 billion USD trade deficit with Russia, as Russia exports oil to China while importing a lot of Chinese goods. Around 1/3 of these trades are settled in the CNY, and set to increase. Further, while the offshore CNY market is growing, its deposits balance across major offshore trading hubs stands at more than 1.5 trillion yuan – significant but not enough to cause tidal waves in the CNY trading.
Instead, the currency issued and deposits from other depository financial institutions have expanded significantly on the PBOC’s balance sheet. Or that the PBOC has been sterilizing the CNY inflow from record trades, as evidenced by the surge in the supply of CNY in the past few years (Figure 7). Unfortunately, the opaque nature of the central bank accounts and transactions makes it impossible to grasp every single detail of the myriads of these operations. That said, the direction of cross border fund flow is clear.
Figure 7: The PBOC has been sterilizing trade flows and thus increasing money supply. 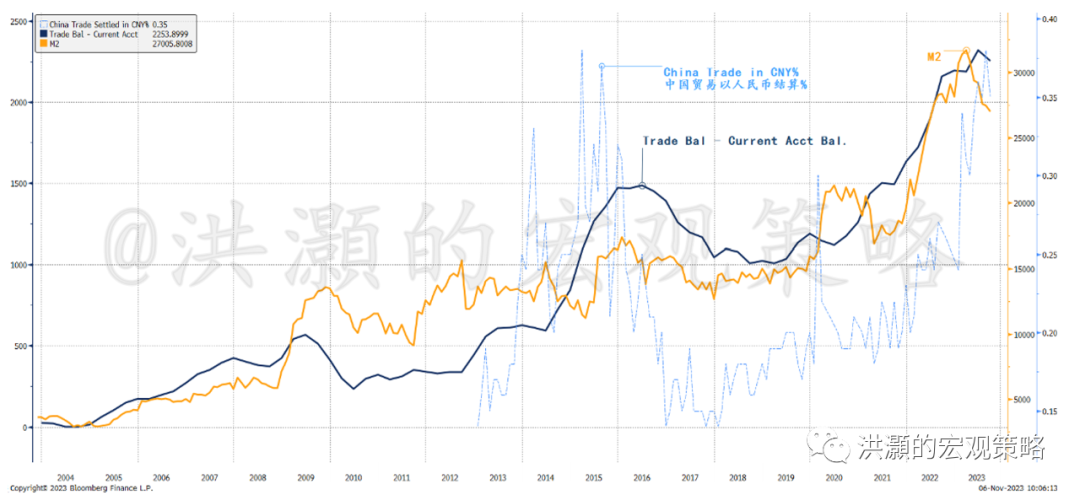
The CNY REER cycle shows a similar picture as the indicators aforementioned. If we adjust the CNY REER using our 850-cycle theory (details in my previous thematic report, not discussed here), we can see that the CNY REER has clearly arrived at its cyclical lows. Consistent with our 850-Cycle theory, each CNY REER cycle lasts about seven years consisting of two short cycles of three and a half year each (Figure 8).
Figure 8: The CNY REER has bottomed, and confirms that last October is an important low. 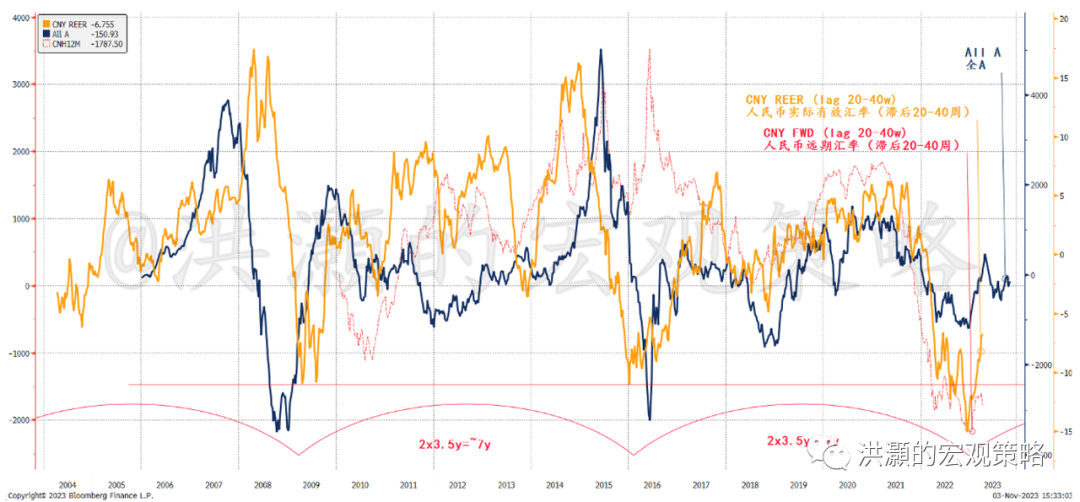
This CNY REER cycle is consistent with our theory of China economic cycle. The Chinese economic cycle is driven by inventory activities and the PBOC’s policies. We have quantitatively verified its existence for the past three decades, and have written extensively in our previous research and in our bestselling book titled “Forecast: The Economy, the Cycle and Market Bubble” (2020, CITIC Press).
The CNY forward rate has also bottomed in tandem with the CNY REER. While the REER measures the real purchasing power of the CNY, the CNY forward shows the implied market expectation of CNY depreciation is also bottoming. Both rates are closely correlated with China’s stock market that also exhibits a similar cycle of 3.5 years (Figure 8).
We can also measure the market expectation of depreciation from the gold price in CNY vs. USD. Not surprisingly, the implied expectation for depreciation has plunged and diverged from the PBOC’s balance sheet. It suggests that the market pessimism towards the CNY has reached its extreme – why else would one overpay for gold, a commodity probably conform to the Law of One Price the most? Such extreme pessimism should start mean reverting soon.
Figure 9: Gold implied CNY depreciation diverging from PBOC’s balance sheet and China’s FX reserve. 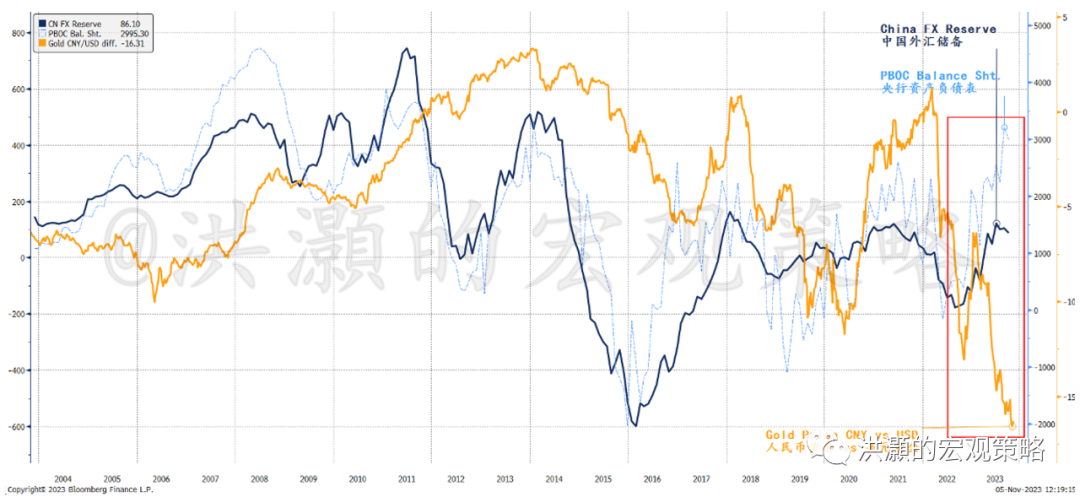
China-US Yield
Gap Stabilizing
There have been many schools of thoughts why Chinese stocks have underperformed so severely in a year when the Chinese economy has been emerging from COVID lockdown. Many blame the exit of foreign capital due to compliance and ideological clashes as the causes. We have demonstrated in the previous sections that the CNY depreciation can explain much of the underperformance in stocks. And we have seen similar episodes in the past.
Figure 10: Chinese stocks are highly correlated with US long yields. 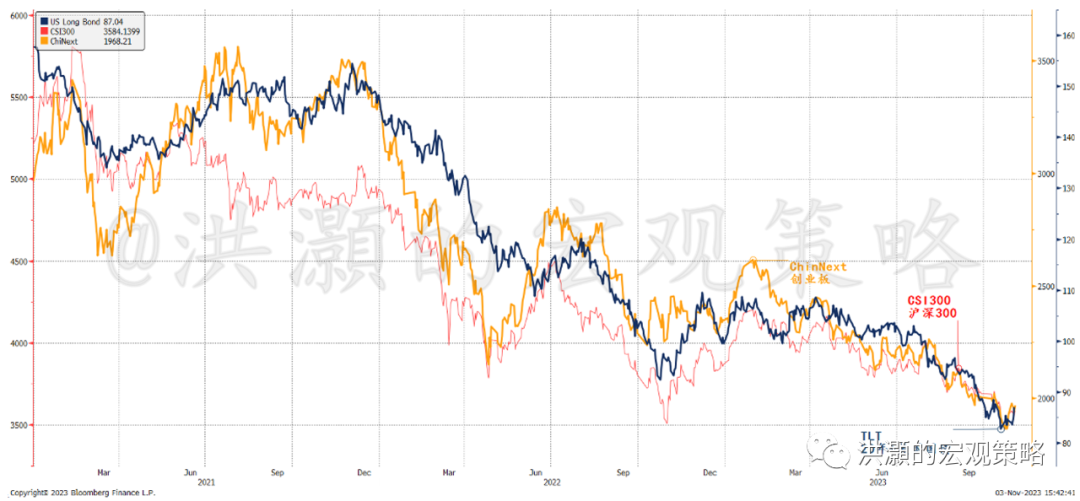
As the CNY’s drag on stocks will soon alleviate, we look at the second component of investment return, namely, the interest rate level in China and its gap with that of the US. In Figure 10, we can see that the US long yield has an almost perfect correlation with the Chinese stocks. That is, the US interest rate can explain much of the variance in Chinese stocks’ underperformance.
The return from CNY carry trade has fallen to its decade low (Figure 11). To continue this trade when the CNY has reached its cyclical lows, and the Fed is pausing and could be soon cutting, is perilous. Even if the yield gap would stay largely constant in the coming months, a steady CNY with intermittent appreciation spurs can easily ruin many carry traders. Incidentally, the Chinese internet index is also attempting to consolidate around its decade low.
Figure 11: Return from CNY carry trade is around its decade low. 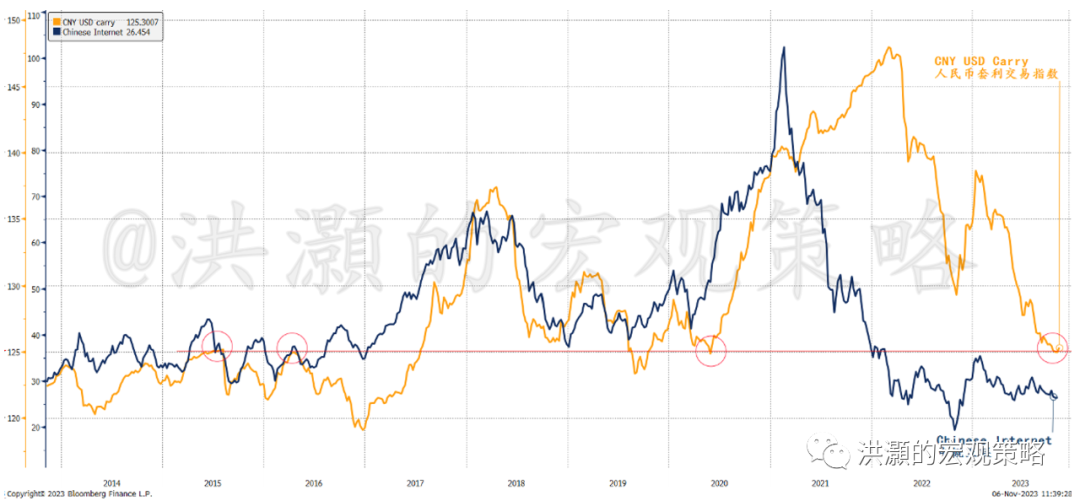
The US treasury futures has started to price in four cuts in 2024. There is little meat left on the bones for the CNY carry trade. It will soon start to normalize.
Market Outlook
One of the puzzles from last two years has been the rapid growth in Chinese deposits. A common explanation has been that the Chinese is not buying properties and therefore deposits increase. They call it “excess saving”.
Figure 12: Foreign trade drives deposit buildup; onshore market broke the secular trend line. 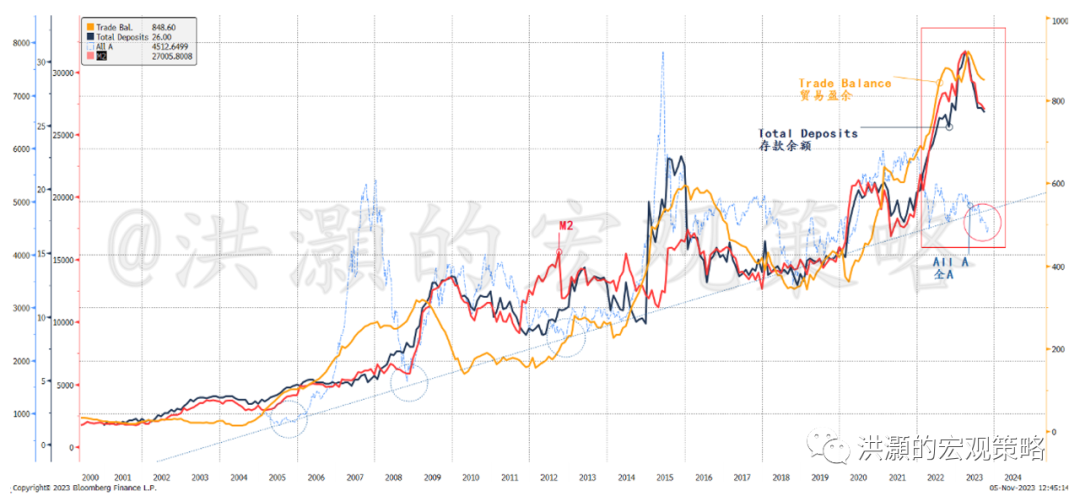
But saving is the saved income after consumption. This saved income is then allocated towards property, stocks, bonds, or deposits. Uncertain times will encourage people to consume less and save more, but how the saved income is allocated between different asset classes won’t change the balance of the deposits, as any transaction would involve buying and selling between two parties – A’s money becomes B’s deposit, while B’s property is retitled to A. Thus, the theory of “excess saving” cannot fully explain the rapid rise in deposit balance and the languishing stock performance.
China’s trade balance has diverged significantly from current account balance, and has been rising in tandem with China’s M2 broad money supply (Figure 12). That is, China has been sterilizing its FX flows from foreign trade and adding to the domestic money supply. It is an all-too-familiar operation from a time more than a decade ago when FX sterilization created bulk of China’s domestic liquidity.
However, the abundant liquidity has not immediately turned into stock performance or property sales, but is parked in bank deposits instead (Figure 12). It is probably due to subdued risk appetite. Note that the A-share index has broken below its secular trend line, suggesting extreme risk aversion and hence mean reversion later. Incidentally, Chinese income confidence is improving, even though the consumer confidence is lingering around its all-time low (Figure 13).
Figure 13: Chinese income confidence is healing, auguring well for Chinese consumption. 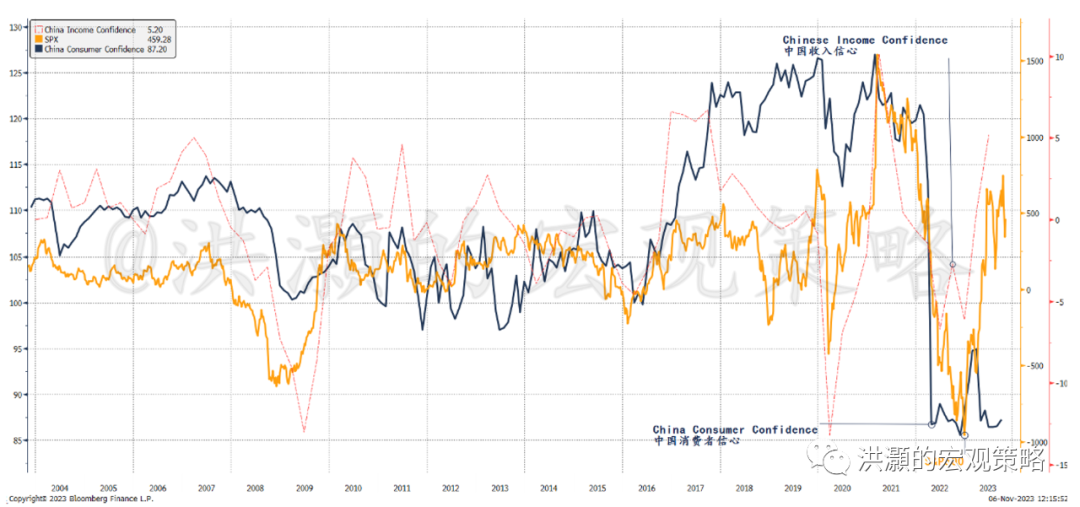
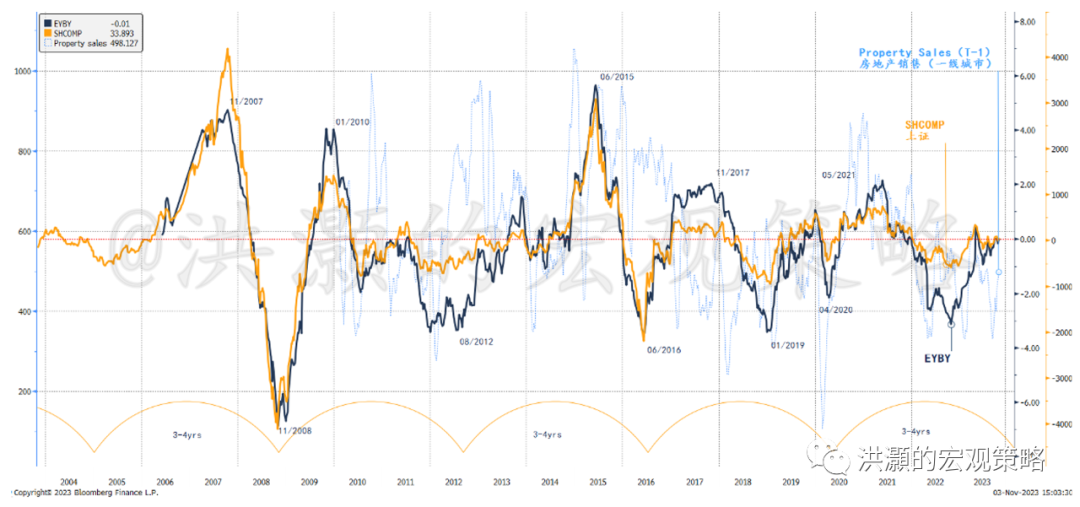
Our proprietary EYBY model that tracks China’s economic short cycle of every three to four years has also been improving, consistent with our discussion above (Figure 14).
Our EYBY model for the Shanghai Composite forecasts a trading range for the next twelve months to be just under 3,000 to ~3,500. For the Hang Seng Index, our EYBY model continues to confirm that the ~15,000 level that we witnessed during the brutal selloff in late October 2022 should be an important low of the current cycle, with an upper bound of ~23,000. These two trading range forecasts are comparable with our forecasts last year.
Figure 14: Our proprietary EYBY models for on- and off-shore market are around neutral to positive. 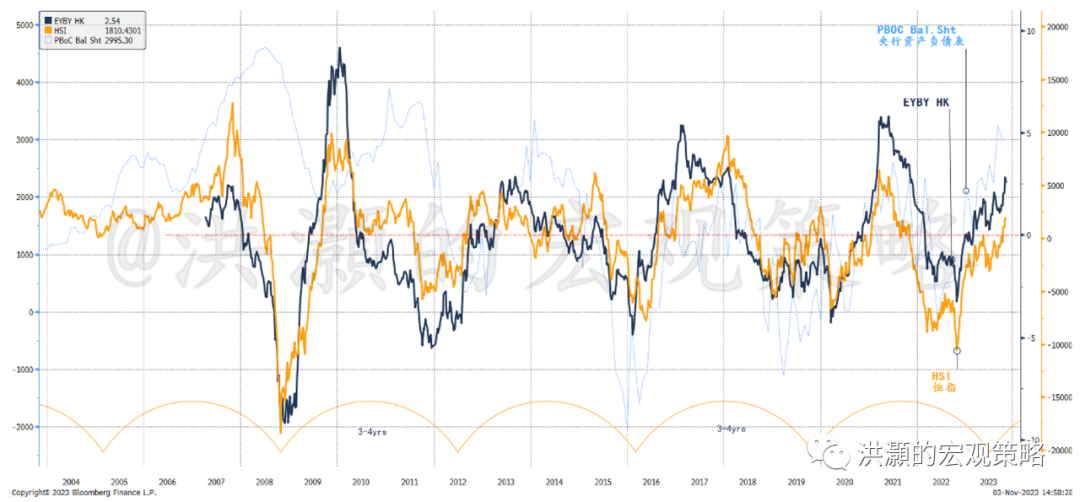
Our EYBY model correlates very closely with the underlying index, especially after adjusting for the bubble years of 2007 and 2015 (Figure 15). Our forecast trading range for the Shanghai Composite published in November 2021 was the lone voice for caution against the bullish consensus at that time and invited censorship scrutiny. Again, our call to “Mai!Mai!Mai!” in late October 2022 was the lone voice against prevalent pessimism then.
Figure 15: Our EYBY model correlates closely with the actual index movements.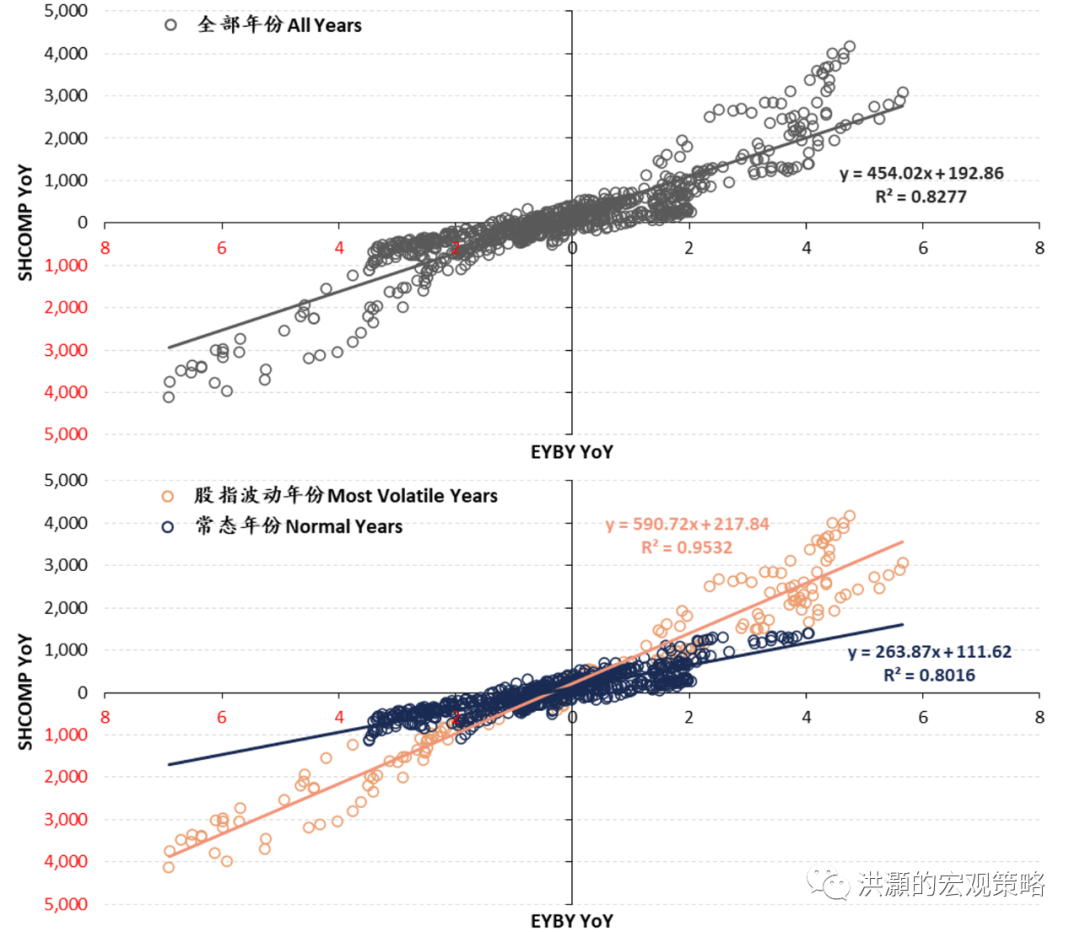
Risks to Our Forecast
Our base-case forecast scenario is for a US soft landing and thus the Fed ending its tightening cycle, but China property malaise could drag on. If so, the China-US yield gap should not widen much further and should even start to narrow, lessening its pressure on the CNY and the incentive for carry trade. And a US soft landing is good news for the global economy.
While the Chinese property could be slow to recover, as long as it would not worsen substantially from 2023, then it could muddle through. And lower USD yields could mean a better refinancing environment for the beleaguered developers.
But what if the US economy would go into recession in 2024? Although the market is starting to price in four Fed rate cuts in 2024, such expectations indeed imply a sharp slowdown in the US economy to compel the Fed to cut. Incidentally, our US economic cycle indicator is showing a slowdown in the US economy, in tandem with the US LEI.
Figure 16: US economic cycle is slowing down. 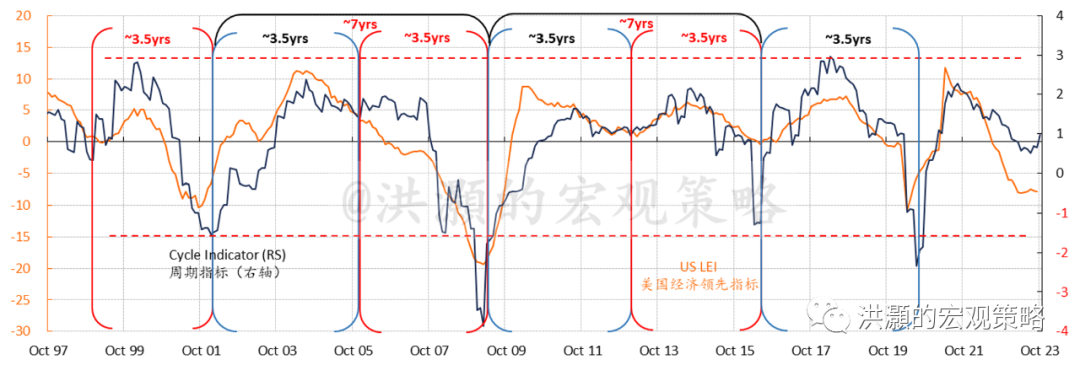
That said, we note that the manufacturing PMI around the world has been in the recessionary zone for months. But the service industries have proven resilient. Even in the Chinese economy that is still struggling to emerge from the trough of its economic cycle, the consumption data have beaten expectations.
Meanwhile, our US semiconductor cycle indicator, another of our proprietary leading economic indicators for the US, appears elevated (Figure 17). While at a high level, the US semiconductor cycle’s strength can extend for some time, similar to the previous three cycles since 2009 – if history is a guide.
If so, while the US manufacturing sector will likely continue to slowdown, its semiconductor industry that has been the new engine of economic growth, and has indeed been contributing to the productivity improvements in the US, will continue to give. And its potential to change the world should not be underestimated.
Figure 17: The US semi cycle indicator is elevated, but the cycle’s momentum can be extended. 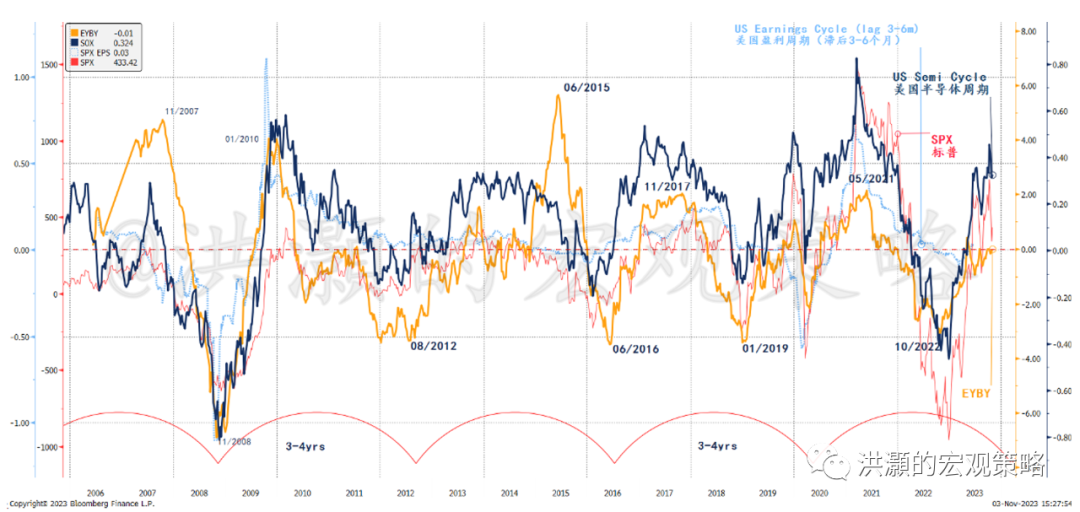
The Chinese economic cycle, which had reached its bottom early this year, continues to trough and has been struggling to jump start a new cycle as it used to (Figure 18). The reason is palpable: the Chinese property sector that normally would have initiated a new investment-inventory cycle has been under the weather.
With an aging demographic and dwindling birth rate, as well as a deceleration in the country’s urbanization process, the demand that has been the pillar of Chinese property investment-driven growth is waning. Simply, there are the 1.4 billion people, target urbanization rate is 75% in the next decade – roughly 1% p.a. new urbanization. That is, around 14 million people with average living area per cap of ~40 sqm, equivalent to a total annual demand of around 600 million sqm.
At the peak year of 2021, China sold 1600 million sqm. In 2022, it was ~1200 million sqm and this year it has been ~700 million. That is, the sales in 2023 have been quite close to the underlying demand from urbanization, with some demand from living quality improvement. And some old secondary housing could be phased out of the market. So ~700 million sqm must be closer to a more sustainable sales level than the 1600 million sqm sold in 2021. And we must consider the additional 6000 million sqm that is under construction, and a sales/inventory ratio of ~20 months given the current sales rate.
Consequently, we are seeing property sales down single digit YTD on a national level, investment down ~10% y/y, and land sales down around 50% YTD. Sales in the coming years will probably slide further. But as long as investment’s drag on growth stabilizes, China can probably still manage GDP growth of 5% this year and next.
Figure 18: China economic cycle is troughing.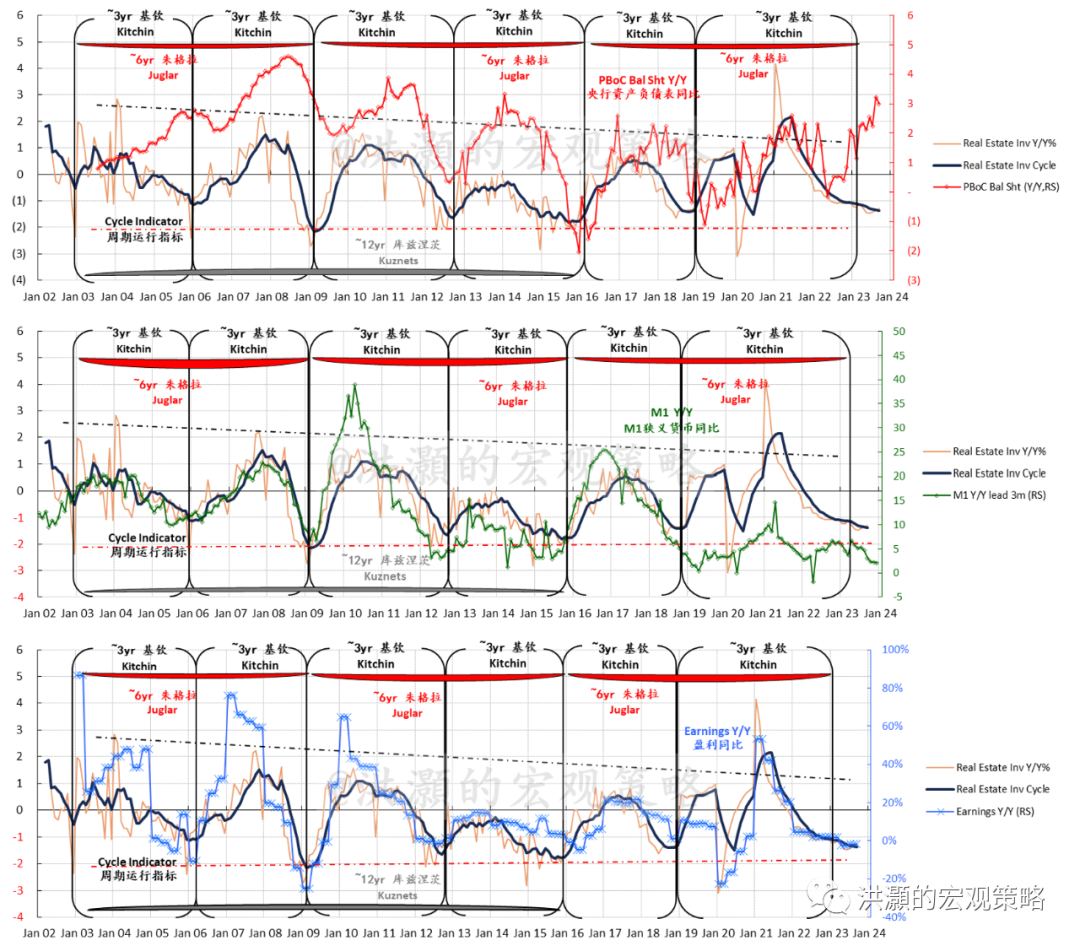
Finally , if the US long yields stay high as term premium normalizes, then the pressure on CNY and capital outflow will linger. But the pressure will not be the same when the US 10-year is going from 3% to 5%.
Disclaimer: Investing carries risk. This is not financial advice. The above content should not be regarded as an offer, recommendation, or solicitation on acquiring or disposing of any financial products, any associated discussions, comments, or posts by author or other users should not be considered as such either. It is solely for general information purpose only, which does not consider your own investment objectives, financial situations or needs. TTM assumes no responsibility or warranty for the accuracy and completeness of the information, investors should do their own research and may seek professional advice before investing.
Very professional analysing of data! I love both the format and the content of your passage!
Great ariticle, would you like to share it?
Upppppppppppp
hh