BIG TECH WEEKLY | What makes the success of Big-Techs in 2023?
Big-Tech’s Performance
Market’s in drawdown mode in the first week of 2024, starting with big-techs, which had benefited greatly in 2023. Crowded trading due to overlap of various factors may exacerbate the speed and extent especially in downturn. At the same time, risk aversion’s coming back, there has been a clear sector rotation in the stock market.
As of the close on January 4th, big tech stocks experienced varying degrees of pullback over the past week. Among them, $Tesla Motors(TSLA)$ had the largest decline at -8.99%, followed by $Apple(AAPL)$ at -5.82%, $Amazon.com(AMZN)$ at -5.72%, $Meta Platforms, Inc.(META)$ at -2.99%, $Alphabet(GOOG)$ $Alphabet(GOOGL)$ at -2.84%, and $Microsoft(MSFT)$ at -1.64%.
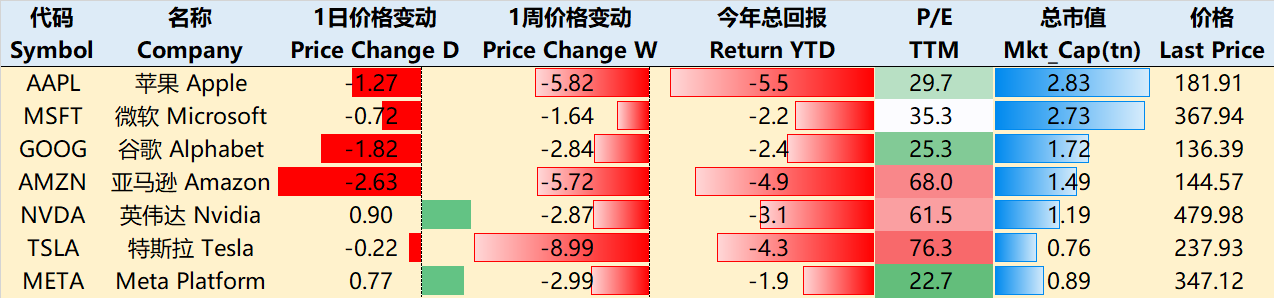
Apple's market value is now close to that of Microsoft.
Big-Tech’s Top Newsfeed
Apple's stock was downgraded twice this week due to concerns about iPhone sales prospects.
$Qualcomm(QCOM)$ released a mixed-reality headset chip to compete with Apple's Vision Pro.
The Apple Vision Pro is expected to be launched in the U.S. on January 27, 2024.
Microsoft is changing the PC keyboard by adding an artificial intelligence key.
The $New York Times(NYT)$ sued OpenAI and Microsoft, claiming that their copyright for written works had been infringed, seeking billions of dollars in compensation.
OpenAI will launch a "Custom GPT Store" next week.
Google plans to eliminate cookies for all Chrome browser users by the end of this year.
NVIDIA released the RTX 4090 D graphics card for the Chinese market, starting at 12,999 yuan.
Intel's autonomous driving $Mobileye Global Inc.(MBLY)$ saw its stock plummet by 29% due to guidance cuts.
Tesla's fourth-quarter deliveries exceeded expectations, with a 38% year-on-year increase in vehicle deliveries for 2023.
Tesla's Cybertruck was involved in its first reported traffic accident, causing only "minor" injuries, while the opposing $Toyota(TM)$ Corolla suffered almost no damage.
Big-Tech’s Key insights
Where does the excess return of the big tech portfolio come from?
We created an equally weighted investment portfolio "TANMAMG" consisting of the seven largest tech companies, rebalanced quarterly. How did it perform in 2023?
Return
The total return for the full year of 2023 was 108.99%, far exceeding SPY's 26.19% by more than three times, and also surpassing QQQ's 55.03%. (Note: This uses the total return of ETFs tracking the S&P 500 and Nasdaq 100 indices.)
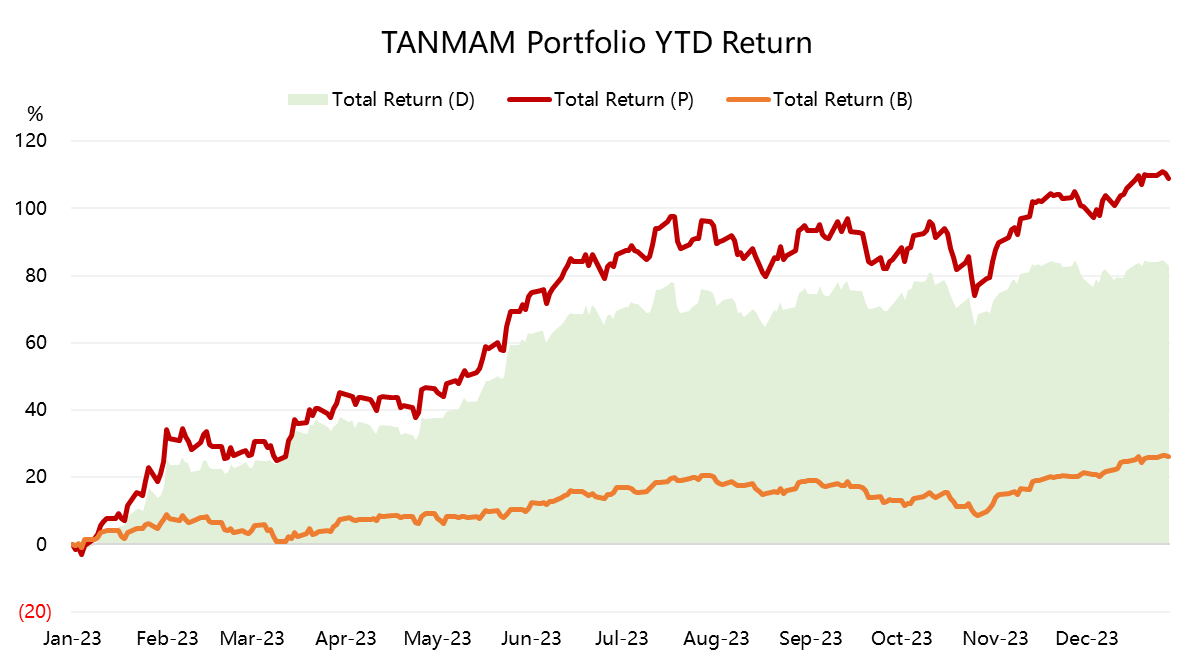
The standard deviation of the portfolio is 26.09%, which is twice as high as the 13.03% of SPY. However, the Sharpe ratio is 4.26%, higher than the 1.7% of SPY. The information ratio of the portfolio is 4.26%, which can be considered quite excellent.
In terms of relative excess compared to SPY, 32.98% of the excess return comes from allocation, and 49.76% comes from stock selection.
Risk
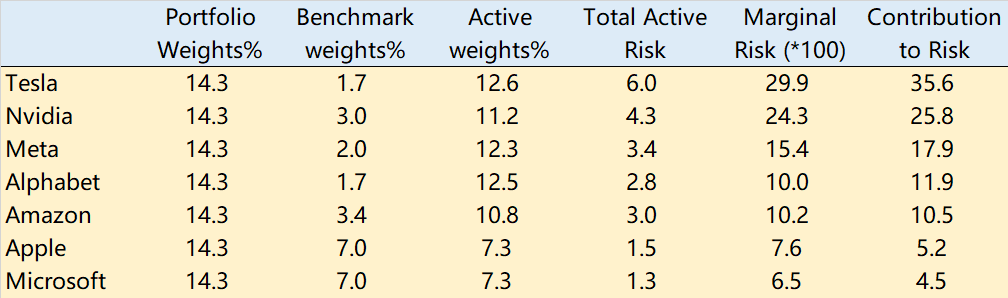
Looking at the component stocks, since the portfolio is equally weighted, this means that compared to the benchmark, TSLA, META, NVDA, and AMZN bring a relatively large active weight. Therefore, the risk (volatility) brought by individual stocks is also greater, with Tesla being the main source of volatility.
In terms of marginal risk, the high volatility of TSLA and NVDA also brings higher marginal risk, contributing 35.6% and 25.8% to the overall risk, respectively, while MSFT is the most stable, with a risk contribution of only 4.5%.
Factors
Looking at the exposure to risk factors such as industry and size, the largest active exposure is to the growth factor. However, just because these companies have a large market value does not mean they are not "growth" companies. This includes not only Nvidia's "multiple large better-than-expected growth" this year but also the incremental industries brought about by AI.
Next is the momentum factor, indicating that large technology companies are better able to maintain their advantage after gaining an upward trend. "Chasing the rise" is completely feasible.
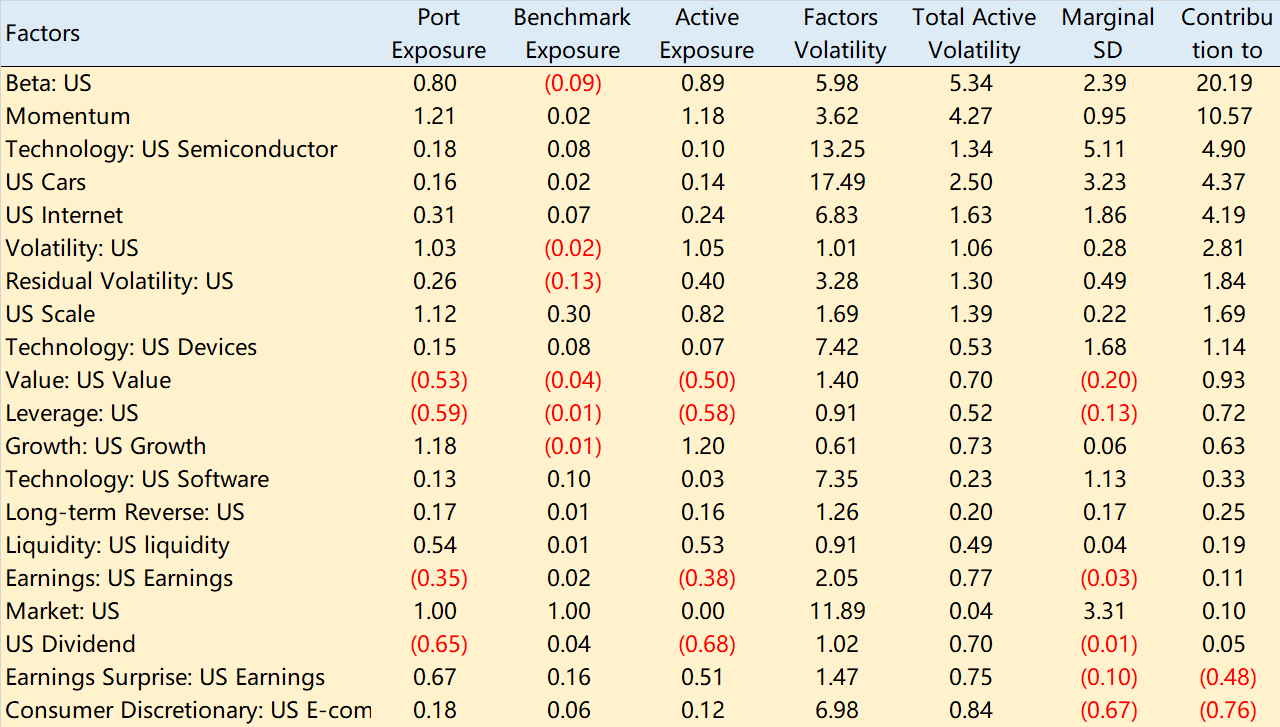
In addition, the excellence of financial reports (profit exceeding expectations) is also an important contribution. The industry factor exposure is not concentrated, with larger exposures including U.S. internet, U.S. automotive, U.S. e-commerce, and other sub-industries, corresponding to the main business of these companies.
In terms of factor risk, high marginal risks include semiconductors, U.S. automotive, market beta, while high contributions come from beta and momentum, which is clearly a double-edged sword.
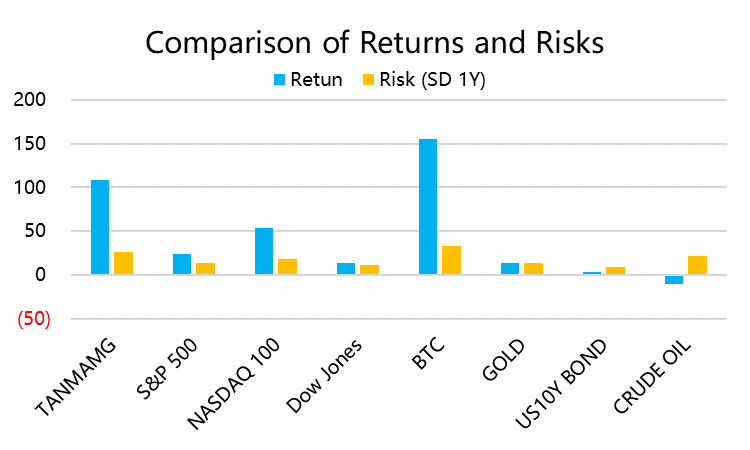
Comparison with other assets
Compared to other asset classes, the portfolio's return of 108.99% is second only to BTC, but in terms of unit risk return, it is also leading compared to other stock indices, oil, gold, and bonds.
Disclaimer: Investing carries risk. This is not financial advice. The above content should not be regarded as an offer, recommendation, or solicitation on acquiring or disposing of any financial products, any associated discussions, comments, or posts by author or other users should not be considered as such either. It is solely for general information purpose only, which does not consider your own investment objectives, financial situations or needs. TTM assumes no responsibility or warranty for the accuracy and completeness of the information, investors should do their own research and may seek professional advice before investing.
- GoodLife99·01-06great read!1Report