BIG TECH WEEKLY | Why AI mania is somewhat different with Dot Bubble?
Big-Tech’s Performance
The market is still focused on large technology stocks. Despite fluctuations, the concept of AI continues to attract funds with different risk preferences. Powell's testimony was not surprising, and after emphasizing the risk of cutting rates too late, the market's risk appetite has rebounded.
As the earnings season nears its end, investors' demands for growth stocks have clearly increased. Companies that are able to exceed expectations are further rewarded in the aftermarket.
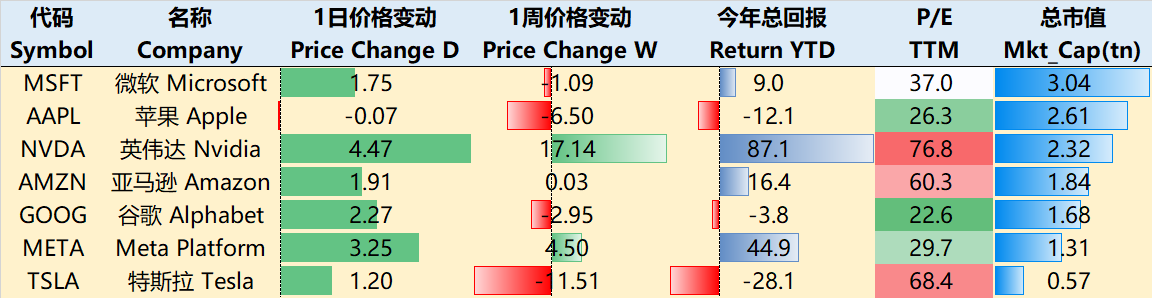
As of the close on February 29th, the best performing large technology companies in the past week were $NVIDIA Corp(NVDA)$ +17%, followed by $Meta Platforms, Inc.(META)$ +4.5%, $Amazon.com(AMZN)$ +0.03%. The other four companies experienced declines, with $Microsoft(MSFT)$ -1.09%, $Alphabet(GOOGL)$ -2.95%, $Apple(AAPL)$ -6.5%, $Tesla Motors(TSLA)$ -11.51%.
Big-Tech’s Key Strategy
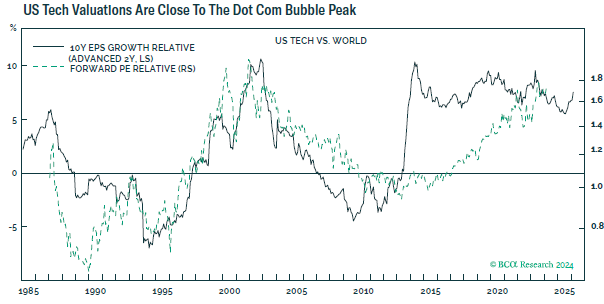
Concerns about a bubble are left to supply and demand cycles. Many investors are worried that the current AI craze is beginning to resemble the "Dot Bubble" of more than 20 years ago, but experienced investors would believe that although history is very similar, it will not simply repeat itself.
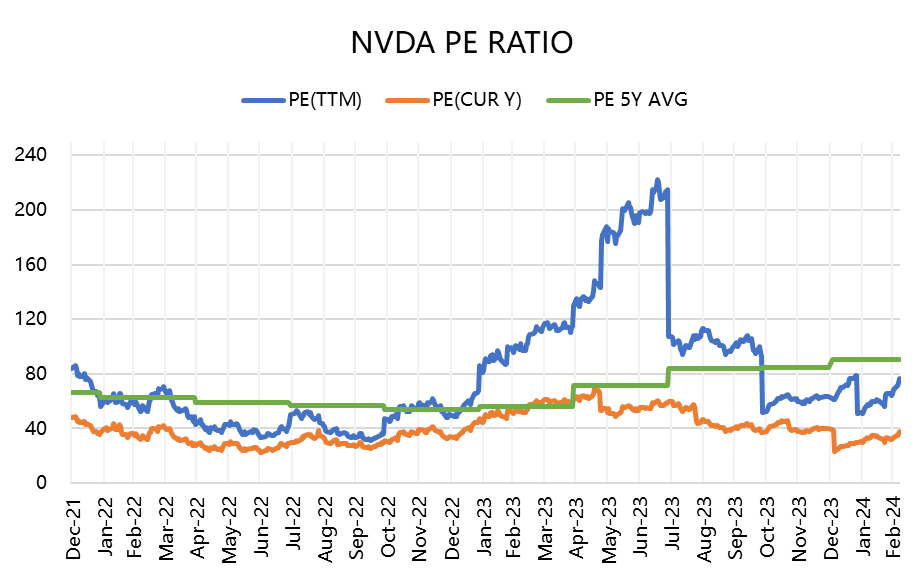
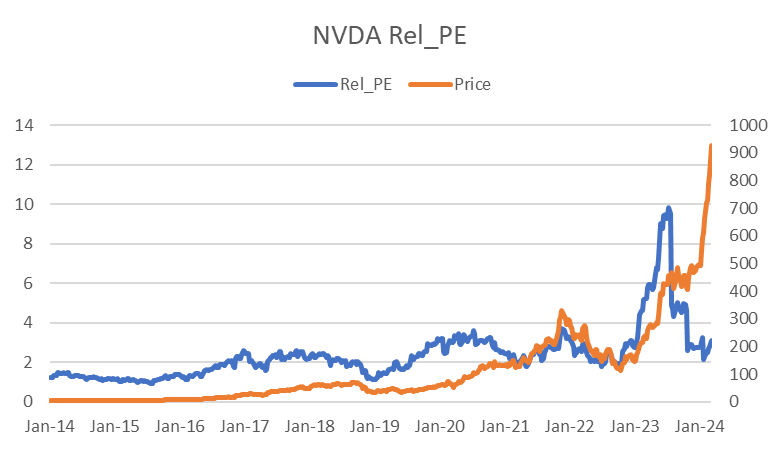
Although NVIDIA's trend also suggests high valuations, its valuation is lower compared to hardware companies during the dot-com bubble period.
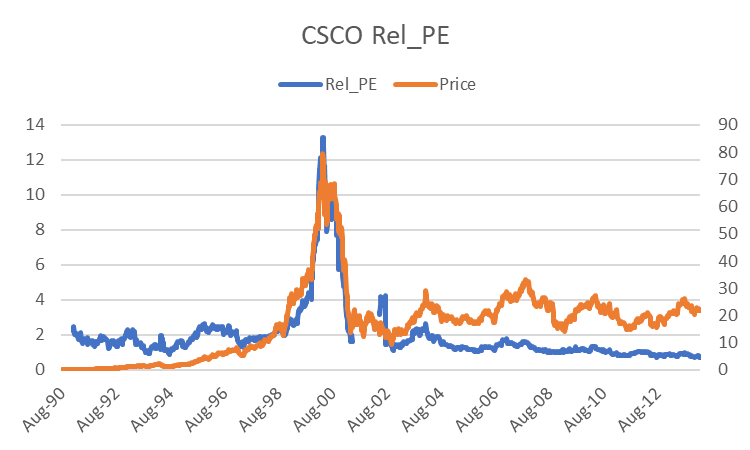
When comparing it with Cisco, which also sold shovels during the Dot Bubble period, NVIDIA's profitability is much higher. Its average net profit margin in the first five years was 27.9%, while Cisco's average net profit margin from 1996 to 2000 was 17.2%.
As hardware represented by chips is still in short supply, its profit margin has not yet peaked.
The current single-quarter net profit level exceeds 55%, and even if it does not exceed 60%, market expectations can be maintained for over 2 years, which is enough to break through the bear market brought about by the bubble.
On the other hand, market expectations for other technology stocks are already so high, and their emotions are more influenced by the supply and demand cycles of their respective industries.
The market is worried that Apple is falling behind in the short term in the AI competition and is facing sales difficulties with its hardware products, causing it to move away from its valuation peak and trend downward.
Google's shift from leading in AI to lagging behind also requires a strong product to reverse the trend, as it currently has the lowest valuation among large technology stocks.
META is very clever, not directly competing with OpenAI head-on, but instead taking the lead in terms of "monetization".
Microsoft and Amazon have relatively stable performance, and their strong cash flow and leading advantages in cloud services are not easily overturned.
Tesla's AI still needs time to mature. Musk's urgency in the short term is not effective, and more importantly, the decline in market enthusiasm has reduced stock and options trading volume, resulting in a backlash against stock prices.
All of these can be understood as "short-term fluctuations" within a 3-5 year cycle.
Big-Tech Weekly Options Watch
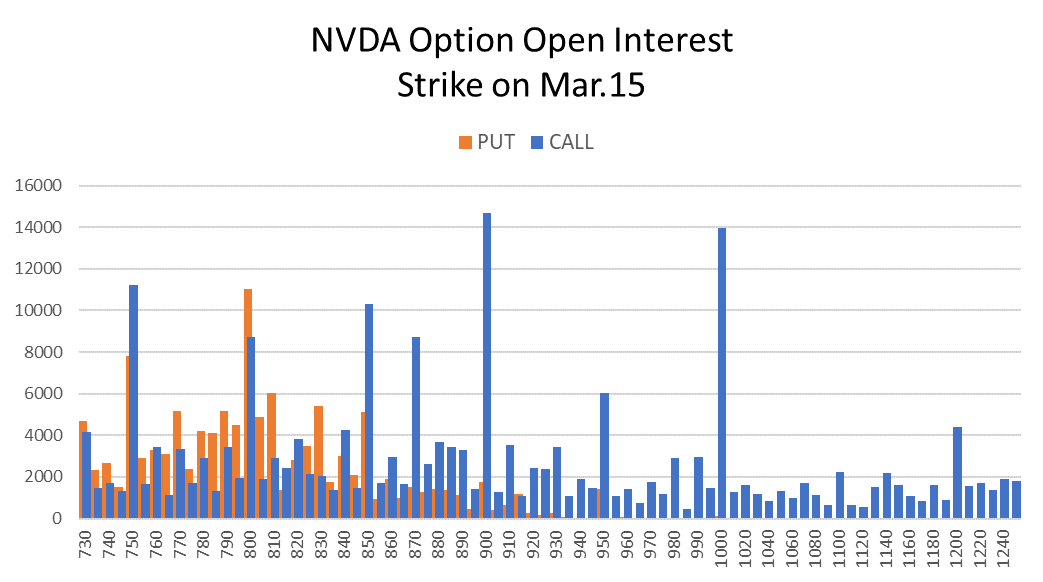
The options positions of chip companies reflect both investors' optimistic or pessimistic attitudes and the speculative sentiment in the market.
For example, the put positions of NVIDIA are almost non-existent above the current price, while the call positions are more evenly distributed (except for a few round numbers), with more in-the-money than out-of-the-money calls.
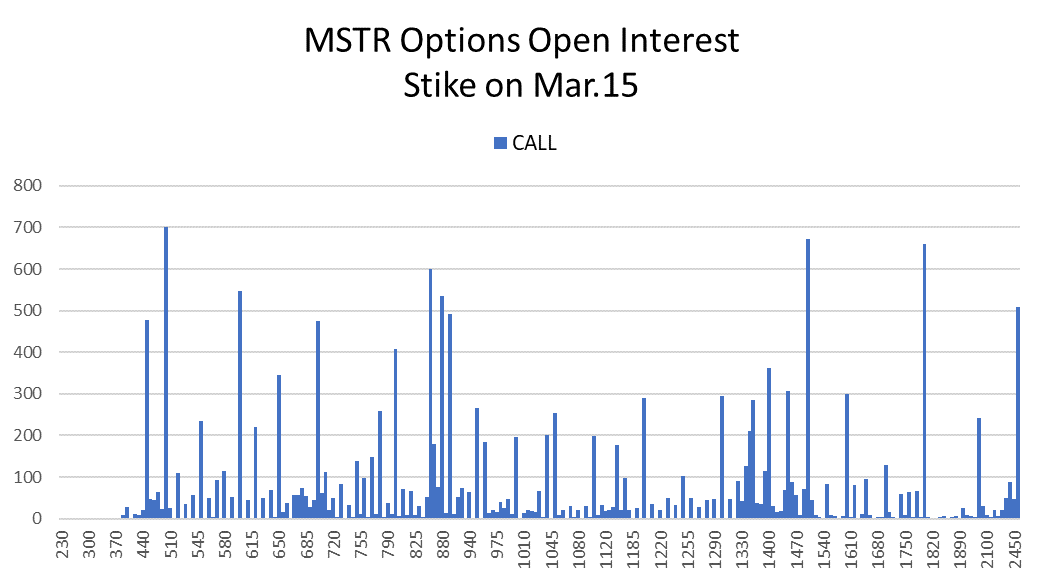
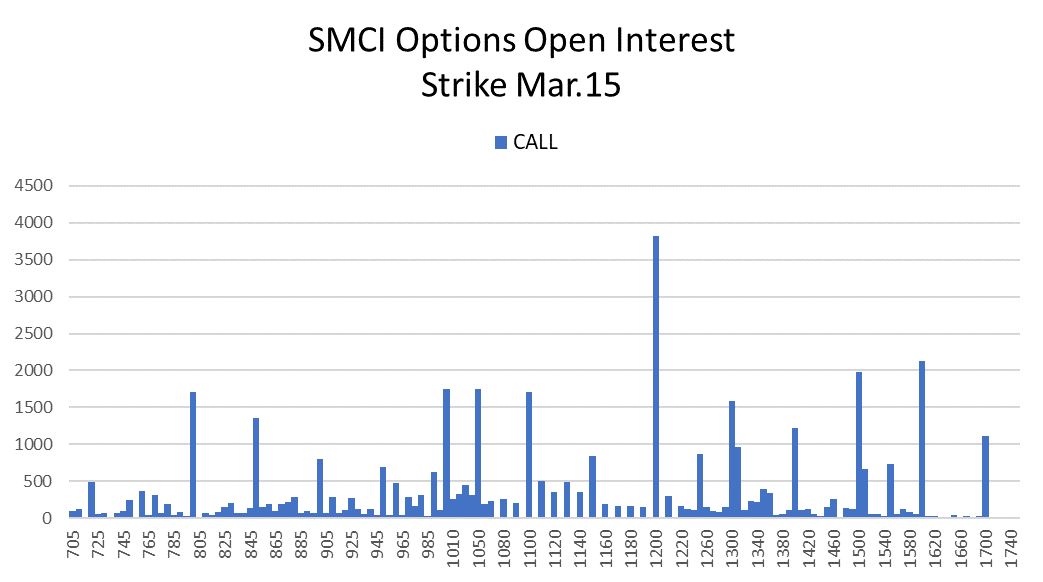
However, the turnover rate is high, and the speculative sentiment is stronger for $SUPER MICRO COMPUTER INC(SMCI)$ , where out-of-the-money calls exceed in-the-money calls, similar to the concept of digital currency with $MicroStrategy(MSTR)$ .
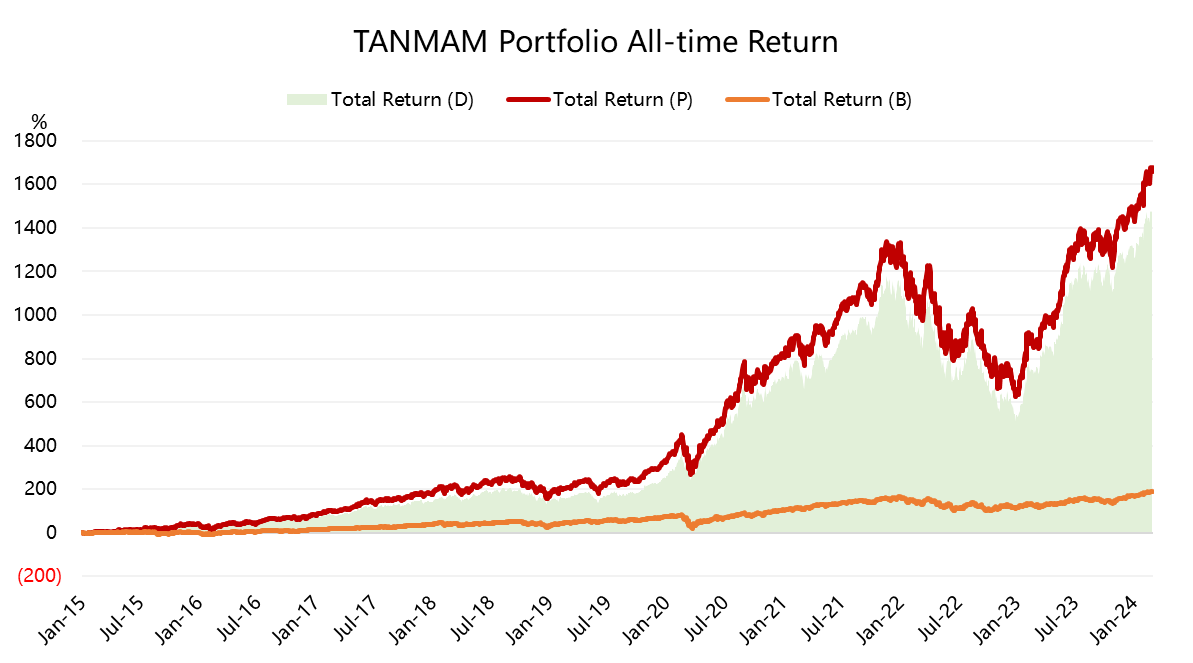
Big-Tech Portfolio
The "Magnificent Seven" forms an investment portfolio ("TANMAMG" combination) with equal weights and quarterly readjustment of weights.
The backtesting results since 2015 have shown significant outperformance compared to the S&P 500, with a total return of 1671.78%, while the SPY return during the same period was 194.61%, reaching a new high. $SPDR S&P 500 ETF Trust(SPY)$
The year-to-date return is 12.01%, surpassing SPY's 8.31%.
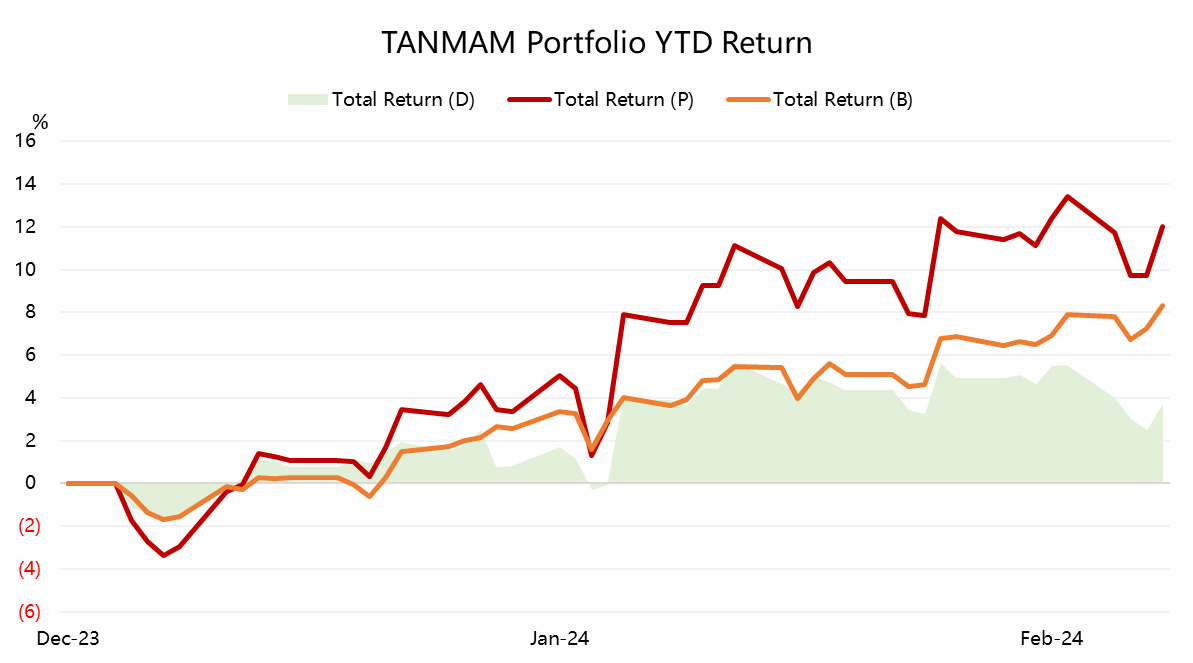
The Sharpe ratio for the combination this year is 4.2, while SPY's is 3.9, and the information ratio for the combination is 2.5.
Disclaimer: Investing carries risk. This is not financial advice. The above content should not be regarded as an offer, recommendation, or solicitation on acquiring or disposing of any financial products, any associated discussions, comments, or posts by author or other users should not be considered as such either. It is solely for general information purpose only, which does not consider your own investment objectives, financial situations or needs. TTM assumes no responsibility or warranty for the accuracy and completeness of the information, investors should do their own research and may seek professional advice before investing.
