Options Riddle
I saw a familiar type of riddle on Twitter that was directed at fundamental PMs. I gave a lazy answer and later improved it with a better answer after my half-assed-ness gnawed enough at me.
I’ll reprint the riddle and the better answer here but spelling out the steps in greater detail than I did on twitter.
Question:
Estimate the price of a $180 call (20% OTM) on a $150 stock with 50% volatility, 3 months to expiry
150 Call Calculation (The ATM option)
We start by estimating the at-the-money (ATM) call value using:
ATM straddle = .8 * stock price * implied vol * √(Time to expiry in years)
ATM Call = .4 * stock price * implied vol * √(Time to expiry in years)
ATM Call = 0.4× $150 × 50% ×√1/4= $15
180 Call Calculation (The OTM option)
The 150/180 call spread links the 150 call to the 180 call.
Call Spread Value Breakdown
The call spread’s total probability of expiring ITM is around 45%. This is another estimate off the top of my head.
Although you’d expect 50%, option models assume lognormal stock distributions because returns are compounded. Compounded or geometric returns are subject to “volatility drain” — pulling median price expectations lower than the forward price.
You can think of the expected value of the $150/$180 call spread in two parts:
- The probability that it expires worth its maximum value of $30. This is P(S>$180)
- The value on average when the stock expires between $150 and $180.
This is 45% — P(S>180)
Computing P(S>180)
Note that the straddle is simply 80% of a standard deviation.
The $180 call is conveniently $30 OTM or .80 standard deviations OTM
We know that 1 standard dev encompasses 68% of a distribution, so at a z-score of +1.0 the one-tailed CDF must be 16%
Spelling that out: 100% — 68% = 32% but we only care about the “up” case when the call is ITM, so we cut that in half to 16%.
Since this exercise is supposed to be all mental math, I’ll guess that a Z-score of 0.80 gives a one-tail CDF of ~ 20%, meaning there’s a 20% chance this call will expire in the money (ITM).
We will assume the 180 strike has P(ITM) = 20%
Expected Value Calculation for the 150/180 call spread
1) The case where stock > 180
E(call spread | S>180) = Max value x P(S>180) = $30 x 20% = $6
2) Case where S is between $150 and $180
E(call spread | 150<S<180) = Average value of the call spread when s is between the strikes x P(stock between 150 and 180) =
$15 x 25% = $3.75
💡Why $15?
The average roll of a die is 3.5
The average roll of a die given that the roll is greater than ‘3’ is 5. This assumes a uniform distribution over that range.
This same style of approximation works well enough for the call spread. Assuming the stock expires between 150 and 180, the call spread is worth $15 on average. The probability it expires between those strikes is the total probability of the stock expiring higher than $150 which I estimated earlier as 45% minus the probability of it roofing above $180 which we estimate at 20%. So the probability of the stock being between 150 and 180 is about 25%
Hence, $15 x 25%
We sum all scenarios where the call spread expires ITM (ie when the stock is above $150):
Call spread estimate: $6 + $3.75 = $9.75
If the 150 call is worth $15 and the 150/180 call spread is worth $9.75, then the 180 call is worth $5.25
Recapping key bits:
- Knowing the ATM straddle approximation .8SV√T
- Guessing that the probability of a >.8 standard deviations ~ 20%
- Estimating that the probability of the stock going up is less than 50% in a Black Scholes price process (and that at 50% vol that probability is lower than say at 16% vol — in fact the drag is proportional to vol squared)
In the twitter discussion, a great link from 2012 emerged:
Calculating option prices in your head (7 min read)
The Hardy Decomposition offers a handy way to estimate OTM option prices in your head. By breaking down an option’s price into intrinsic value and a HardyFactor (which depends on how far you are from the strike, measured in standard deviations), you can quickly approximate the time value of the option.
The following comes from the post:
Option Price = Intrinsic + ATMPrice*HardyFactor
The HardyFactor is:
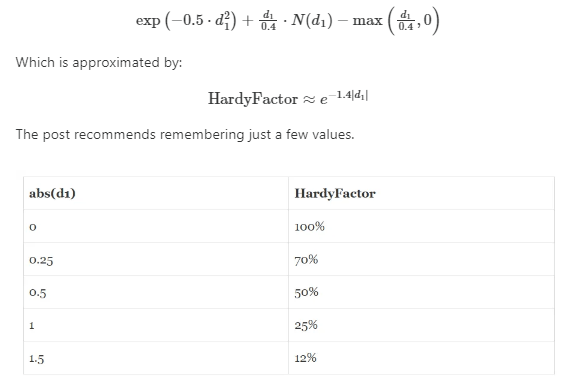
d1 is just how many standard deviations you are from the strike.
⚠️Looking at a quant forum it looks like the HardyFactor approximation is for options being priced with the ‘normal’ distribution version of the B-S model as opposed to the more commonly used lognormal version
Revisiting the riddle
If we revisit the riddle, we know the 180-strike has a d1 = .8 standard devs
If we linear interpolate between .5 and 1 we get a HardyFactor = 40%
Option Price = Intrinsic + ATMPrice*HardyFactor
180 call = 0 + $15 * 40% = $6
My call spread method yielded $5.25
The HardyFactor method (quickly) got us to $6.00
Sound like we have a decent market!
I put into an option calculator:
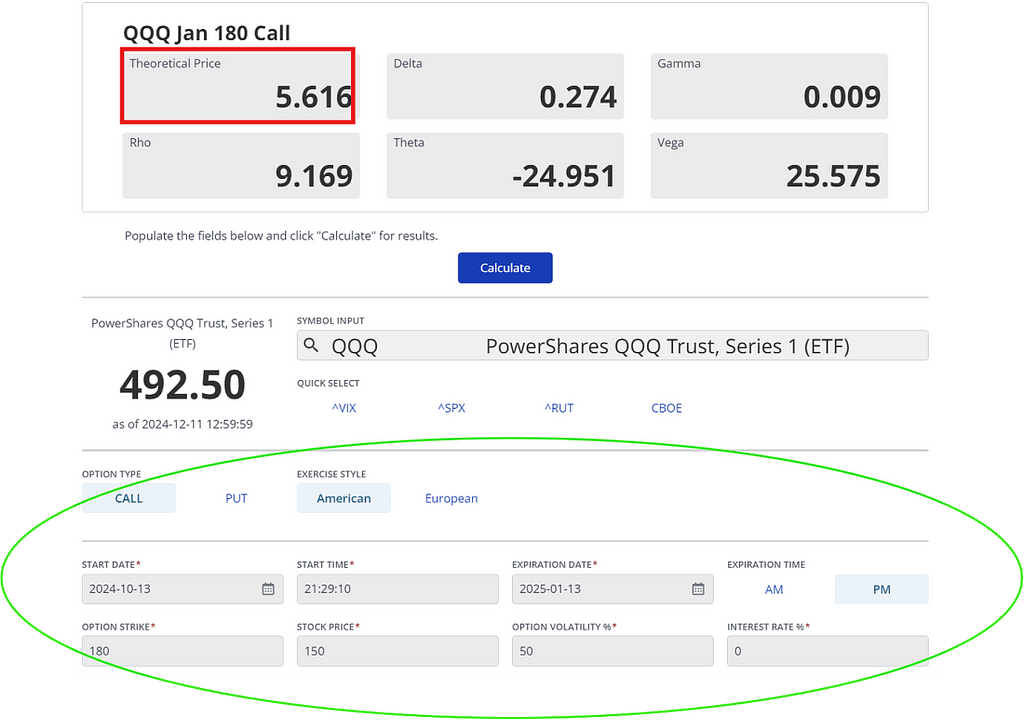
https://www.cboe.com/education/tools/options-calculator/
Pretty fun stuff. If the OTM call IV is discounted by 1 vol point (so -2% skew vs the 50% ATM IV @ the .27 delta option) then the theoretical call value would be $5.616 — .2575 (ie the vega) ~ $5.36
If you want more reinforcement on this I wrote a thorough twitter thread explaining vertical spread comprehension in detail.
Disclaimer: Investing carries risk. This is not financial advice. The above content should not be regarded as an offer, recommendation, or solicitation on acquiring or disposing of any financial products, any associated discussions, comments, or posts by author or other users should not be considered as such either. It is solely for general information purpose only, which does not consider your own investment objectives, financial situations or needs. TTM assumes no responsibility or warranty for the accuracy and completeness of the information, investors should do their own research and may seek professional advice before investing.
- KSR·2024-10-17👍LikeReport