How's China Consumption in 2025 Spring Festival?

The consumer market in January-February was characterized by "policy-driven high growth, upgrading and differentiation".The old-for-new policy has given an obvious boost to communications, home appliances and other categories, while service consumption and rural consumption have become new growth points.
Overall
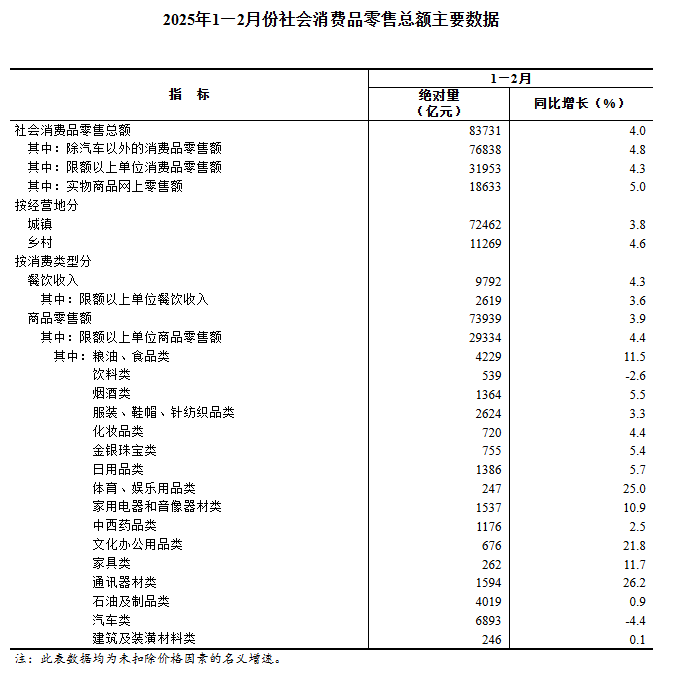
China's total retail sales of consumer goods in January-February amounted to RMB 8,373.1 billion, up 4.0% year-on-year (YoY), accelerating by 0.5 percentage points from the annual growth rate in 2023 (3.5%), indicating a sustained recovery in the consumer market.
Among them, retail sales of consumer goods excluding automobiles amounted to RMB 7,683.8 billion, with an even higher growth rate of 4.8%, suggesting that automobile consumption was a drag on the overall growth rate. 0.35% year-on-year growth in February, and retail sales of services increased by 4.9% year-on-year, further confirming the trend of rebound in consumption.
Performance of different categories
High-growth category: policy-driven and consumption upgrade
Communication equipment: 26.2% year-on-year growth, leading all categories.The effect of the old-for-new policy, coupled with the release of demand for 5G equipment upgrades, boosted sales of cell phones, smart terminals and other products.
Cultural and office supplies: an increase of 21.8%, probably related to the opening of the school season, the enterprise resumption of work to purchase office equipment, but also reflecting the demand for digital office enhancement.
Sports and Recreation Goods: up 25.0%, showing that residents are investing more in health and leisure consumption, and the trend of consumption upgrading continues.
Household electrical appliances and audio-visual equipment: an increase of 10.9%, benefiting from the home appliance replacement policy and energy-saving subsidies to stimulate.
Grain, oil and foodstuffs: up 11.5%, as a basic necessity of life, the demand is more rigid.
Medium and low growth categories: structural differentiation
Furniture: up 11.7%, probably related to the improvement in real estate completion and the release of decoration demand, but the growth rate is lower than the effect of real estate policy in the same period.
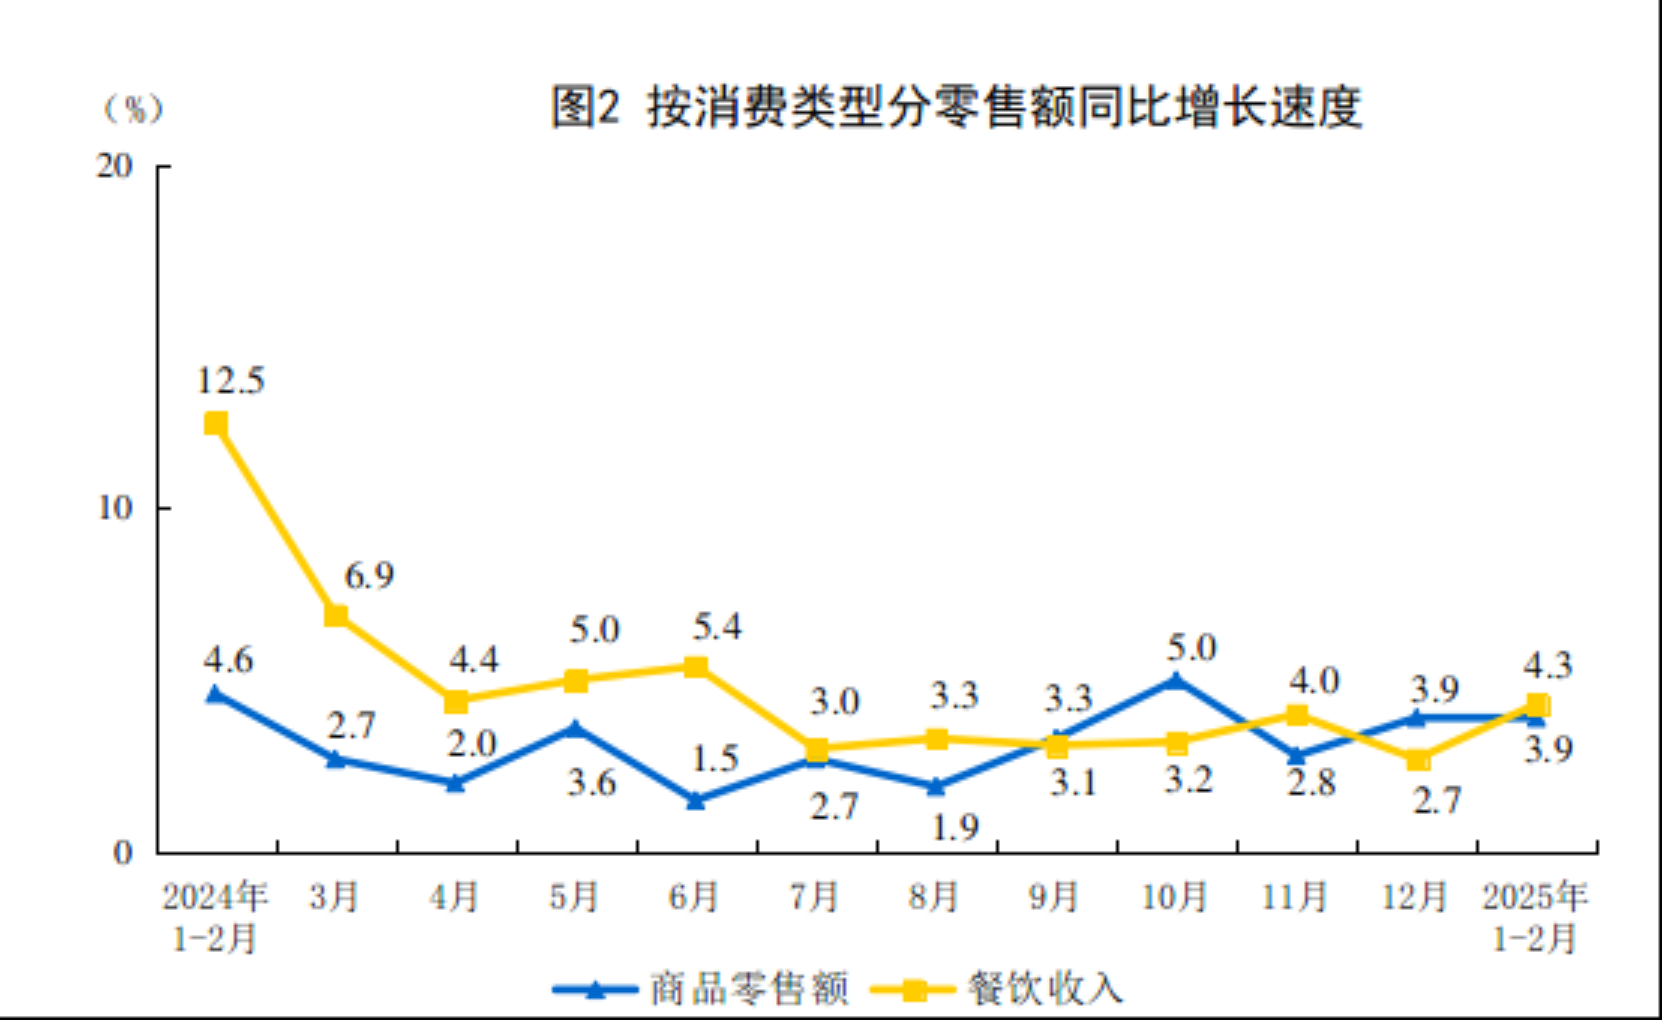
Food and beverage revenue: up 4.3%, higher than retail sales of goods (3.9%), indicating a continued recovery in service consumption, with significant contributions from the Chinese New Year holiday and the restoration of offline consumption scenarios.
Online retail: Online retail sales of physical goods grew by 5.0%, but at a lower rate than overall online retail sales (7.3%).By category, growth was better in food (10.8%) and use (5.4%), while wear declined by 0.6%, reflecting that online consumption was more skewed towards necessities.
Negative growth or downturn categories: weak demand or policy adjustments
Automobile category: down 4.4%, mainly affected by factors such as overdraft demand from promotions at the end of 2023 and the retreat of subsidies for new energy vehicles, while the high base effect exacerbated the year-on-year decline.
Brand specialty stores: retail sales declined 0.8%, likely related to online channel diversion and consumer preference for discount channels (e.g. supermarkets and convenience stores).
Wearable goods: online physical retail sales declined by 0.6%, and offline clothing consumption may be affected by the warm winter and seasonal fluctuations in demand.
Structural Characteristics and Driving Factors
Significant policy-driven effect
Trade-in policy: high growth in communication equipment, home appliances, furniture and other categories directly benefited from the policy support, reflecting the prying effect of the policy on the demand for durable consumer goods replacement.
Basic living goods to maintain supply and stabilize prices: high growth in food and oil food category reflects the resilience of people's livelihood consumption, the policy side of the measures to maintain supply and stabilize prices showed the effect.
Consumption upgrading and stratification coexist
Consumption of upgraded categories such as high-end durable goods (e.g. communication equipment) and sports and recreational goods grew rapidly, indicating residents' rising demand for quality and intelligent products.
Consumption growth in villages (4.6%) was higher than that in cities and towns (3.8%), probably reflecting the release of potential in the sinking market and the improvement of the county commercial system.
Increased differentiation of retail formats
Convenience stores (+9.8%) and specialty stores (+5.4%) outperformed traditional supermarkets (+4.0%) and department stores (+0.4%), suggesting that smaller, specialized retail formats are better adapted to immediate consumption needs.
The negative growth of branded specialty stores may be affected by the strategic adjustment of branded channels (e.g. shifting to online or discount stores).
Automobile consumption dragged down the overall growth rate
Retail sales of automobiles declined by 4.4%, becoming a major drag.Need to pay attention to the follow-up of new energy vehicles to the countryside, trade-in policy to boost the effect of automobile consumption.
Disclaimer: Investing carries risk. This is not financial advice. The above content should not be regarded as an offer, recommendation, or solicitation on acquiring or disposing of any financial products, any associated discussions, comments, or posts by author or other users should not be considered as such either. It is solely for general information purpose only, which does not consider your own investment objectives, financial situations or needs. TTM assumes no responsibility or warranty for the accuracy and completeness of the information, investors should do their own research and may seek professional advice before investing.

