Is the Main Downwave Here?! Don’t Be a Permabear — Know When to Lock In Gains
Recent capital flows in the financial markets paint quite an intriguing picture. While everyone is still watching to see if US stocks have peaked or will continue to surge, massive funds have quietly executed a major rotation. In today's note, I will use the latest market fund data to discuss these ongoing trend changes.
Let me start with the conclusion: the current downward trend in U.S. stocks may not have actually ended, but until the S&P 500 posts a pullback of more than 8%, we should not preemptively assume this is a massive bear market. We can consider carefully building short positions, but once key market signals appear, we must take profits promptly and adjust our bearish view.
$S&P 500(.SPX)$ $SPDR S&P 500 ETF Trust(SPY)$ $Micro E-mini S&P 500 - Jun 2026(MES2606)$ $E-mini S&P 500 - main 2606(ESmain)$ $E-mini S&P 500 - Jun 2026(ES2606)$
Bond and Stock Capital Shift: Blame It on Inflation Expectations?
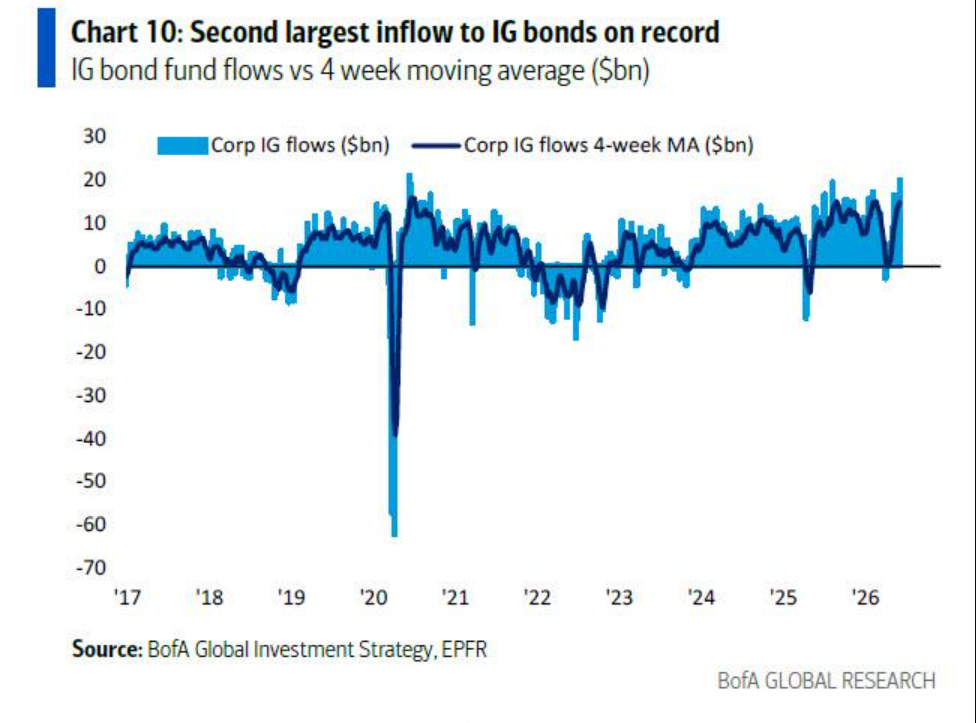
Let us first look at last week's fund flow data. According to the latest institutional statistics provided by Bank of America analyst Michael Hartnett, a massive USD 122 billion rushed into cash last week, while a record USD 39 billion flowed into the bond market. If we break down the bond data, high-yield bonds saw an inflow of USD 3.2 billion, marking the largest scale since May 2025. Emerging market bonds also recorded an inflow of USD 6.3 billion, securing the largest increase in six weeks.
$Invesco QQQ(QQQ)$ $NASDAQ(.IXIC)$ $Micro E-mini Nasdaq 100 - Jun 2026(MNQ2606)$ $E-mini Nasdaq 100 - Jun 2026(NQ2606)$ $E-mini Nasdaq 100 - main 2606(NQmain)$
In contrast, although the equity market still maintained a net inflow of USD 23.1 billion, cryptocurrencies and gold experienced a much rougher time. Last week saw USD 2 billion flow out of cryptocurrencies (the largest outflow since November 2025), alongside a USD 3.1 billion outflow from gold (the largest in ten weeks).
$iShares Russell 2000 ETF(IWM)$ $iShares Russell 1000 ETF(IWB)$ $E-mini Russell 2000 - main 2606(RTYmain)$
The focal point of this data is the US bond market, where the inflow momentum over the past four weeks has been incredibly fierce. These figures tell a clear story: the market is undergoing a logical capital rotation from equities to bonds. The direct catalyst for this shift is rising inflation expectations and the subsequent climb in yields.
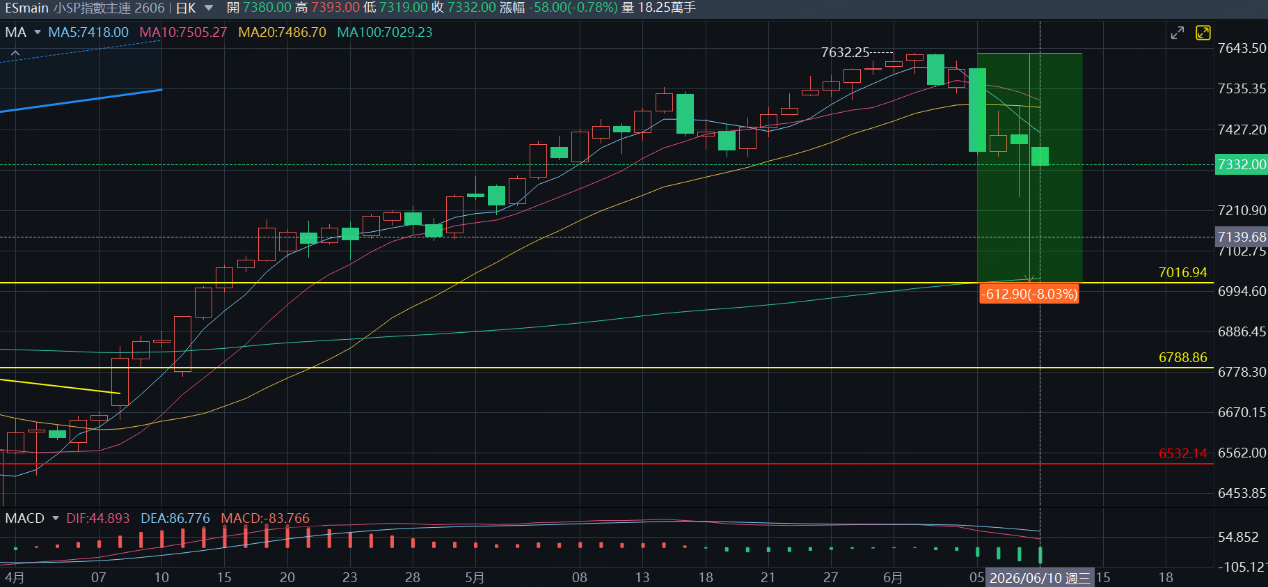
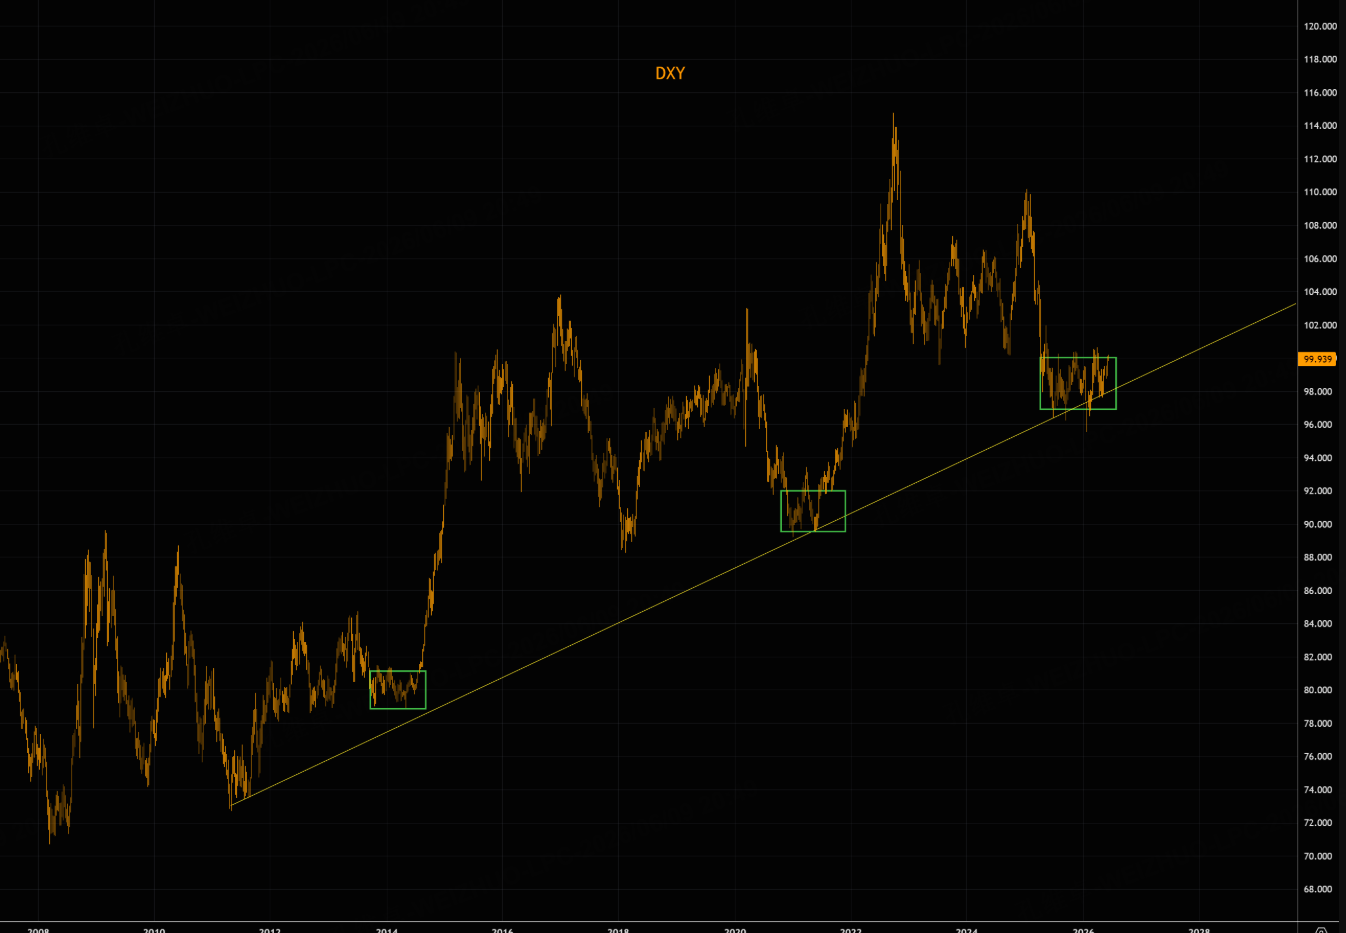
Currently, the upward trajectory in yields remains intact. Looking at US stocks, the S&P 500 has fallen below its 20-day moving average, and the 5-day moving average has formed a death cross with the 10-day moving average. Under these technical conditions, unless the index can reclaim the 20-day moving average in the short term, we must adopt a bearish mindset for now. Additionally, the US Dollar Index shows signs of a potential short-term bottom, meaning it could experience an impulsive rally soon and trigger a broader correction across risk assets.
$Dow Jones(.DJI)$ $E-mini Dow Jones - main 2606(YMmain)$ $Micro E-mini Dow Jones - Jun 2026(MYM2606)$ $Micro E-mini Dow Jones - main 2606(MYMmain)$
AI Bubble is "Too Big to Fail," Limiting Downside Space
Although the short-term trend leans bearish, I have repeatedly emphasized that we must absolutely not act as "permabears." Why? Because we expect the downside of this S&P 500 correction to likely stay within 7% to 8%, and we do not anticipate a deep, structural plunge.
$Cboe Volatility Index(VIX)$ $ProShares VIX Short-Term Futures ETF(VIXY)$ $ProShares Ultra VIX Short-Term Futures ETF(UVXY)$ $NVIDIA(NVDA)$
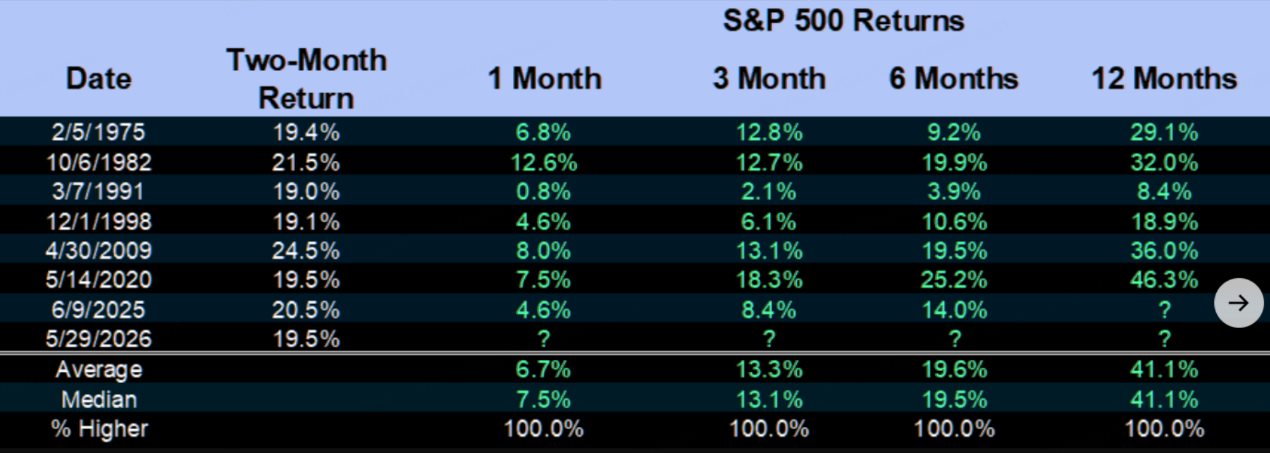
There are two main reasons for this. First, I previously conducted historical backtesting for you: the S&P 500 rising more than 19% within a two-month period has only happened seven times in history. In those seven instances, stock prices never dropped one month, three months, six months, or even one year later. In fact, the average gain in stock prices one year later actually exceeded 40%.
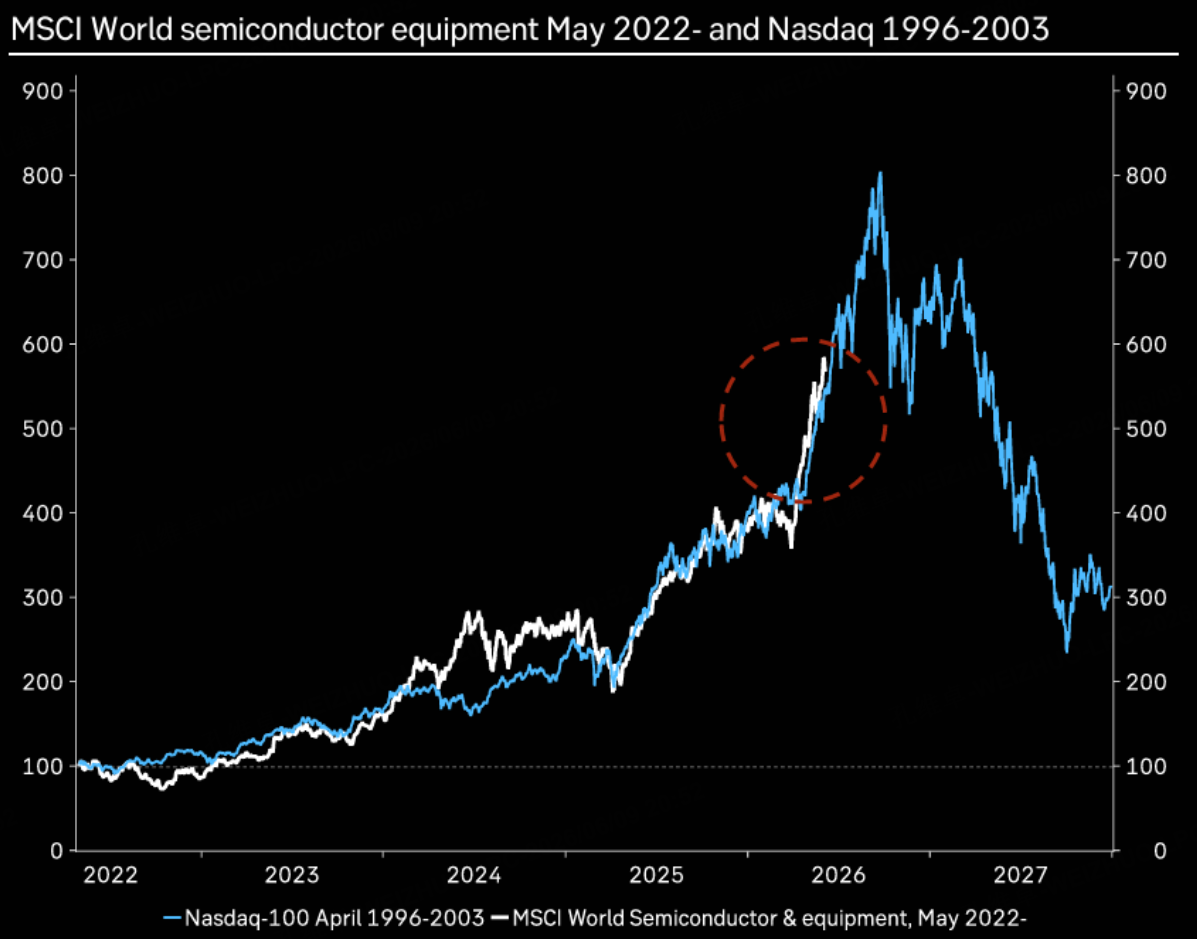
Second, if anyone insists that the current AI boom is a bubble, comparing the global semiconductor index's trajectory to the previous dot-com era suggests we are likely far from the top. As the saying goes, the AI bubble has reached a "too big to fail" status. Therefore, do not hold overly high expectations for this drawdown, and simply take a measured, light approach.
Main Downward Wave in Progress, Why Talk About Bottom Fishing?
So, how should we navigate this bearish trend?
Judging from the current market structure and selling pressure, this correction is highly likely a complete "main downward wave." Unless a massive, unexpected positive catalyst emerges (such as a sudden US-Iran peace agreement, the Strait of Hormuz suddenly reopening, or a crash in crude oil prices), this downward trend is unlikely to be prematurely reversed by sudden bottom-fishing buyers.
Since this is a complete downward wave, ending the decline technically requires the appearance of a "bottom fractal" pattern, assuming no surprise stimuli. However, at present, resistance from the 5-day moving average is obvious, and the 20-day moving average remains incredibly hard to overcome. Under such a strong bearish trend, a bottom fractal cannot form easily. Therefore, traders looking to buy the dip may need to wait patiently.
From a time cycle perspective, this correction will most likely not exceed one month. Once July passes, the probability of US stocks resuming their climb will increase significantly, as validated by our historical backtesting. Thus, the current bearish trend might only persist for about 10 trading days.
Finally, I must remind everyone that the bearish energy this time should not be underestimated. First, the trading volume of put options for the Nasdaq ETF (QQQ) has seen a massive surge.
$Invesco QQQ(QQQ)$ $Micro 10-Year Yield - main 2606(10Ymain)$
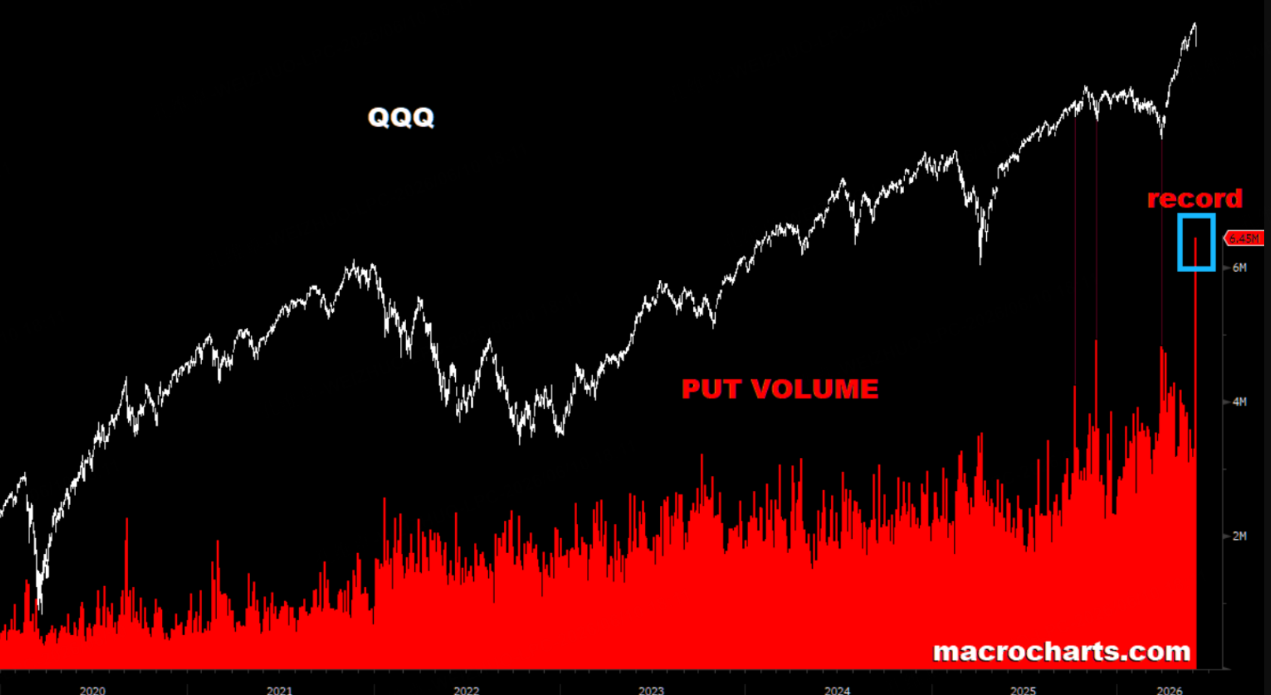
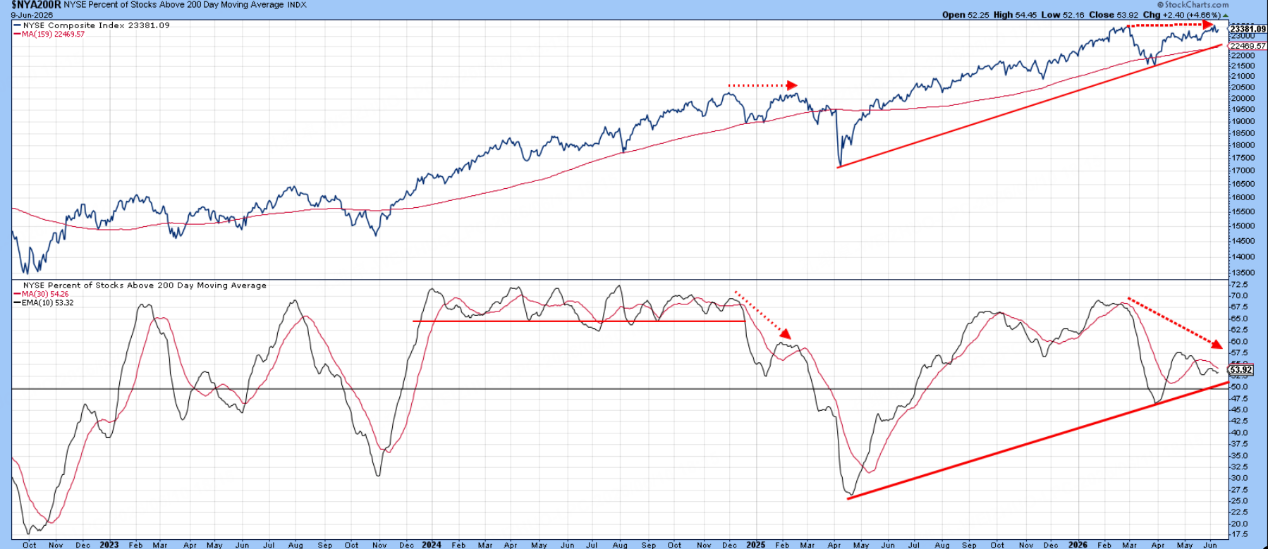
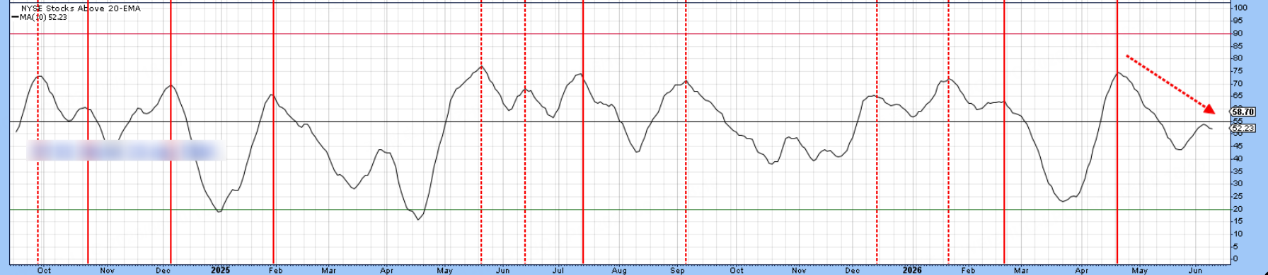
This generates strong negative expectations for a broader peak and decline in stock indices moving forward. Furthermore, the Nasdaq's monthly chart and RSI have shown distinct signs of a cyclical peak. If July's RSI fails to break through resistance, the probability of further declines will only increase. Lastly, the NYSE Composite Index has diverged from its breadth index (the percentage of stocks trading above their 200-day and 20-day moving averages). Once the breadth indicator breaks below its upward trend, the risk of a major top in US stocks remains substantial.
Conclusion
Having discussed so many short-term risks, my core message is that the threat of spreading market fear, peaking, and continuing to fall in the short term is indeed high. However, in the medium to long term, we do not believe US stocks will experience a correction greater than 8% (which translates to dropping below the 7016 level).
$Gold - main 2608(GCmain)$ $Silver - main 2607(SImain)$
In the short term, we will continue to view the market through a bearish lens and cautiously build short positions. Once the S&P 500 returns to around the 7016 level, we will observe whether the market accelerates its decline or rebounds. Traders must promptly consider taking profits as soon as a rebound occurs.
Additionally, friends monitoring gold and silver should note the critical support at their 200-day moving averages. If they fail to push higher in the short term, do not easily turn bullish, as we are still operating within the upward cycle of the US Dollar Index. However, with central banks providing underlying buying support, gold should already be at a relatively low position here, essentially ruling out a cliff-like plunge. In trading, always leave yourself some room to maneuver and follow the primary trend to ensure long-term success.
Disclaimer: Investing carries risk. This is not financial advice. The above content should not be regarded as an offer, recommendation, or solicitation on acquiring or disposing of any financial products, any associated discussions, comments, or posts by author or other users should not be considered as such either. It is solely for general information purpose only, which does not consider your own investment objectives, financial situations or needs. TTM assumes no responsibility or warranty for the accuracy and completeness of the information, investors should do their own research and may seek professional advice before investing.
