Q3 Earnings Insights, Lower Profitability, Lower Estimate.
Q3 earnings season comes to an end,$S&P 500(.SPX)$
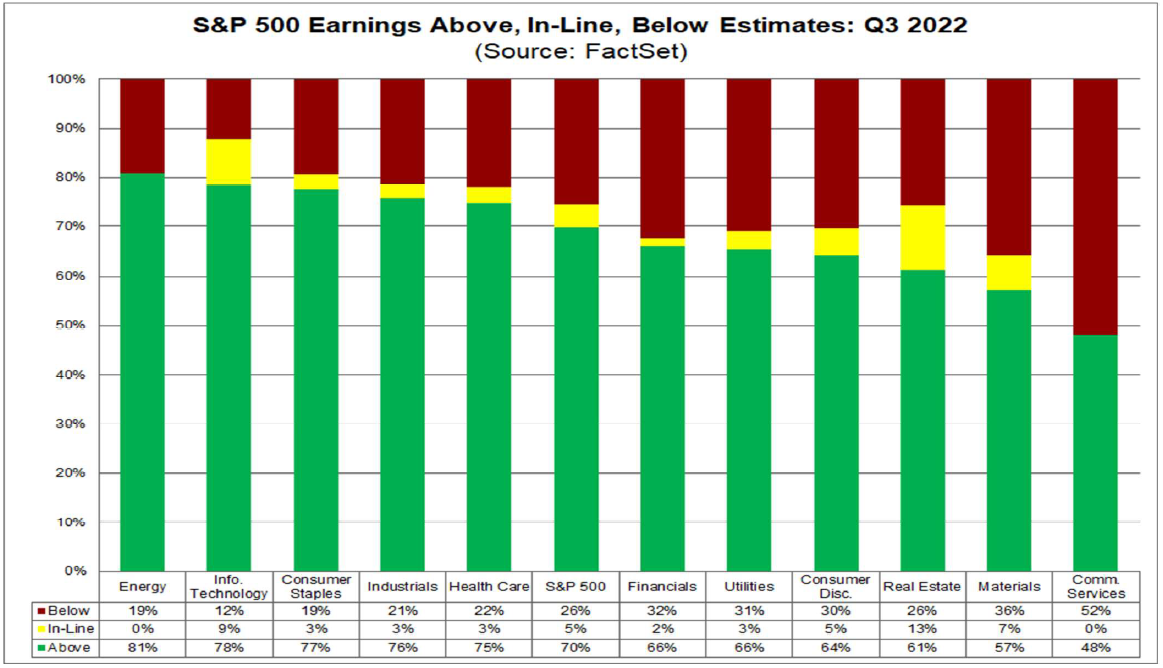
In terms of profitability,
70% of companies beat expectations, below the five-year average of 77% and the 10-year average of 73%. 71% of the companies' revenues exceeded expectations. The range exceeding expectations is 2%, which is lower than the 5-year average (8.7% exceeding expectations) and lower than the 10-year average (6.5% exceeding expectations), which is also the second worst single-quarter profit performance in the past 9 years (the worst is Q3 2020, the most direct quarter affected by the epidemic).
The mixed growth rate of the company's profit is 2.5%, which is the lowest single-quarter growth rate since 2020. On September 30, 2022, the market expected a mixed profit growth rate of 2.6%, which was also lower than expected.
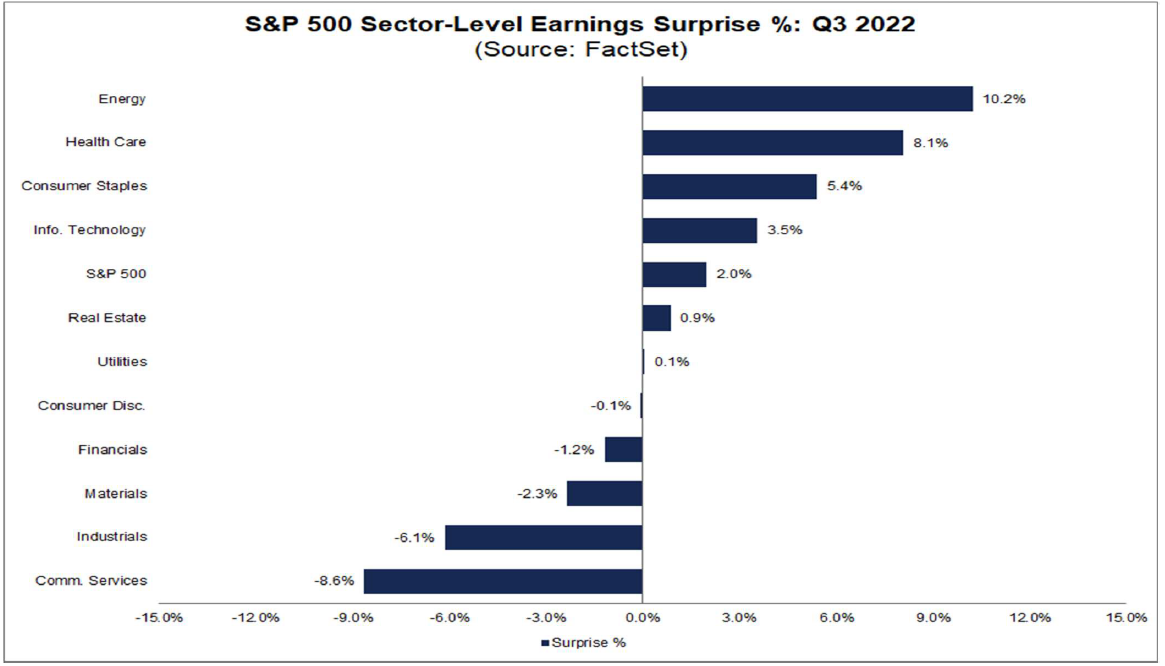
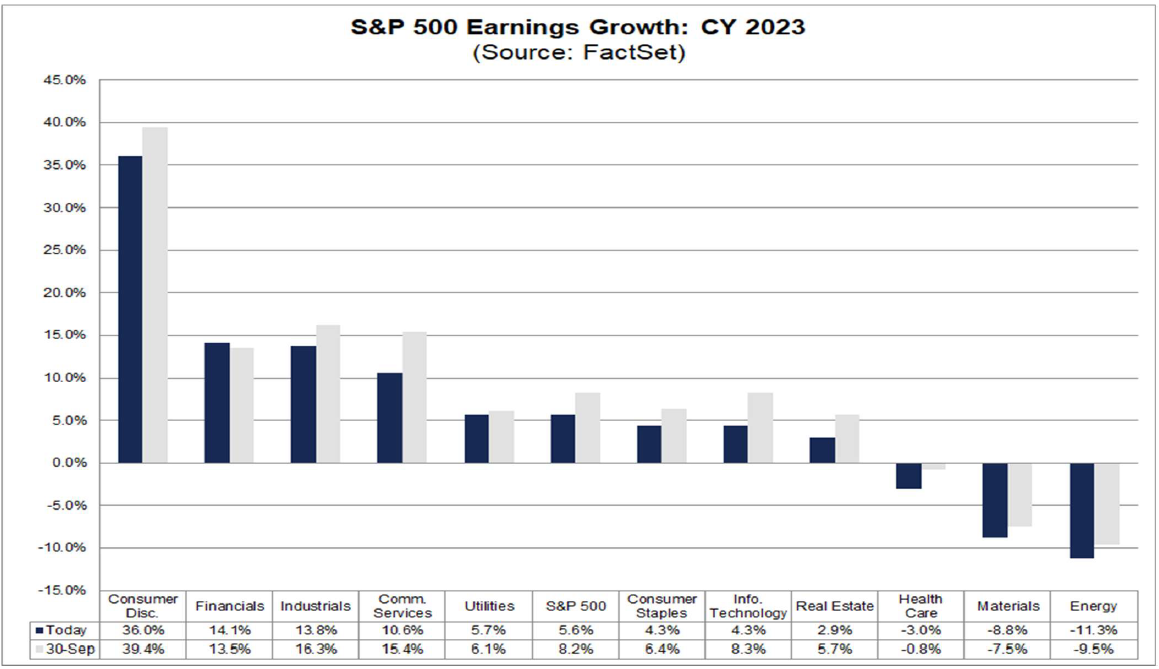
From the perspective of sectors, the actual profits of five sectors are lower than expected. Among them, finance, communication services and raw materials reported negative profits, while the profit growth of four sectors was positive, including energy, real estate, medical care and industry. Positive profits are hedged by loss-making industries. However, the profit growth rate of information technology industry has been greatly reduced.

In terms of overall revenue,
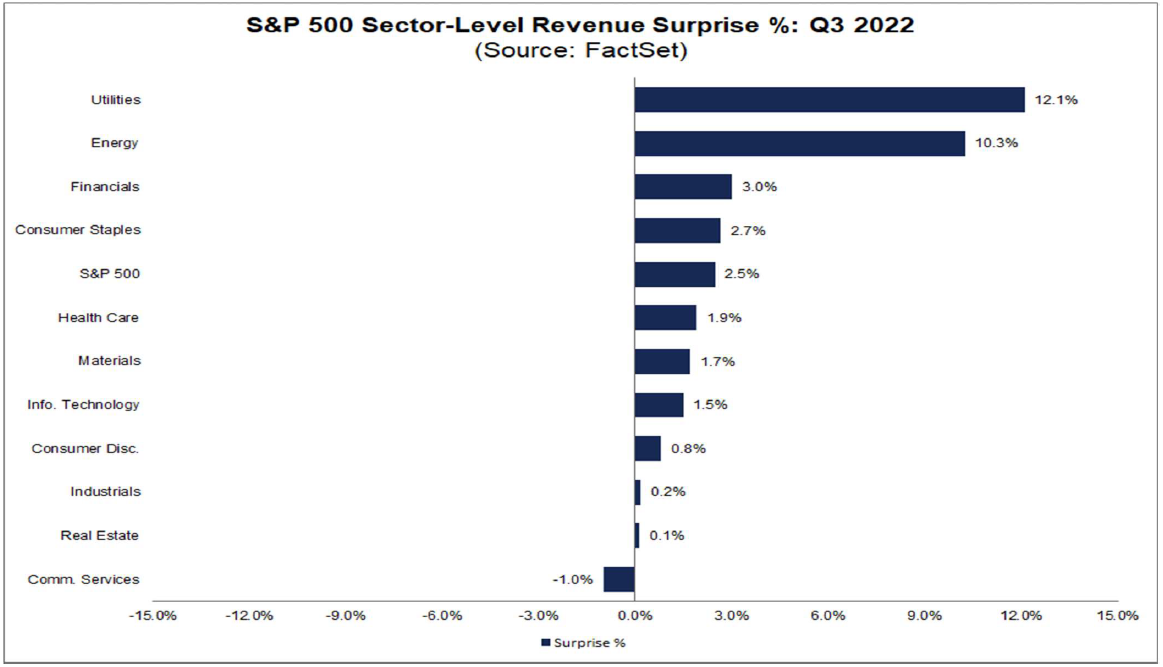
Revenue exceeded expectations in 71% of companies, above the five-year average of 69% and the 10-year average of 62%. On the whole, the revenue exceeded expectations by 2.5%, which was higher than the 5-year average (exceeding expectations by 1.9%) and the 10-year average (1.2%).
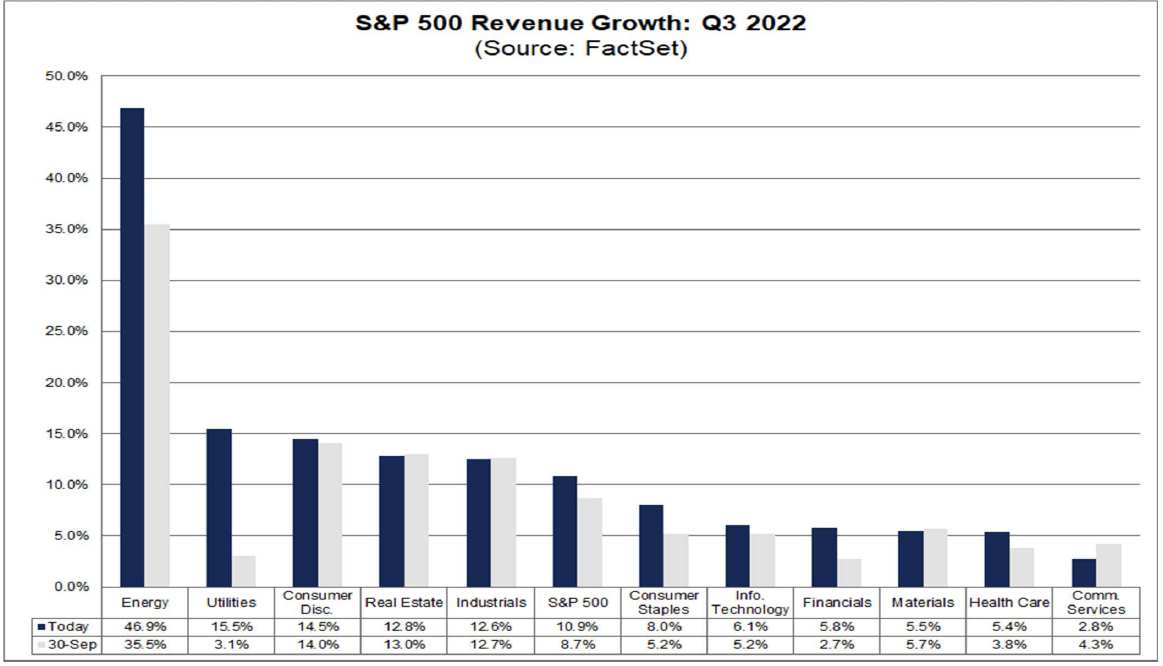
The mixed growth rate of the company's revenue was 10.9%, which was higher than the market forecast of 8.7% on September 30th. This also marks the double-digit growth rate of Peugeot's revenue for seven consecutive quarters.
At the same time, all sectors recorded positive growth, and the largest increase was still in the energy sector.

The prospect of Q4,
Sixty-four companies lowered their EPS expectations and 34 companies raised their EPS expectations. The market's overall profit expectation for Q4 S&P 500 is-2. 4%, which means a decline, but the growth rate for the whole year of 2022 is still 5.2%. Earnings for the whole year of 2023 are expected to be 5.6%.
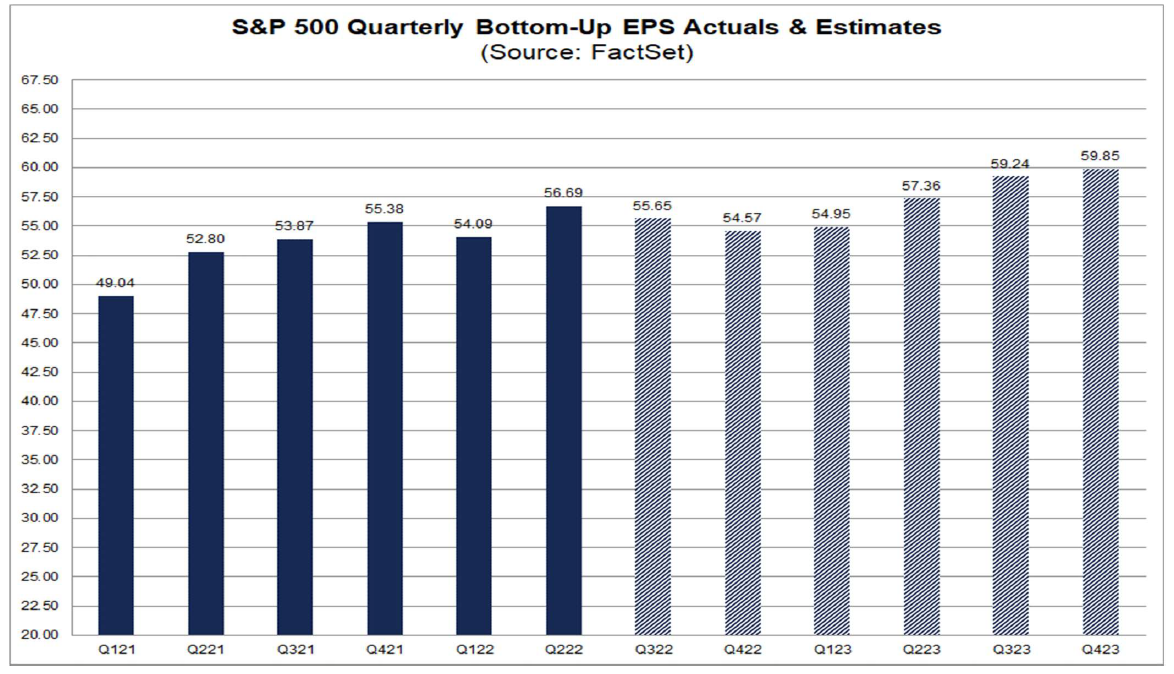
- For 22Q4, analysts expect earnings to decline by 2.4% and revenue to increase by 4.4%.
- For fiscal year 2022, analysts expect earnings to increase by 5.2% and revenue to increase by 10.5%.
- For 23Q1, analysts expect earnings to increase by 1.5% and revenue to increase by 3.8%.
- For 23Q2, analysts expect earnings to increase by 0.8% and revenue to increase by 1.2%.
- For fiscal year 23, analysts expect earnings to grow 5.6% and revenue to grow 3.3%

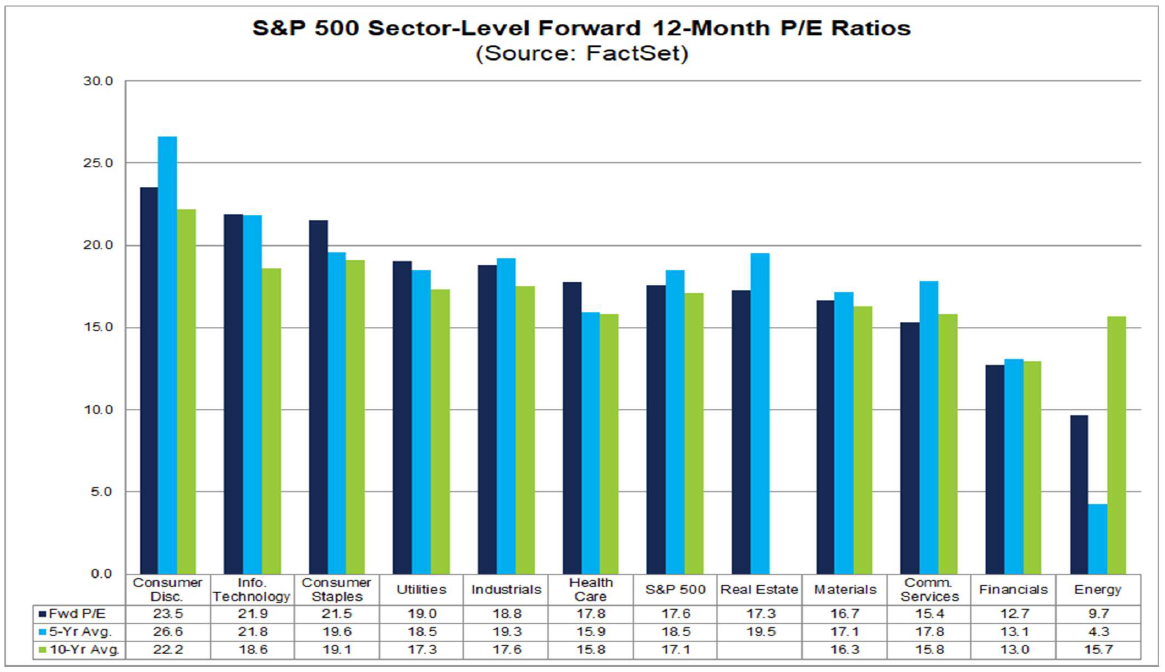
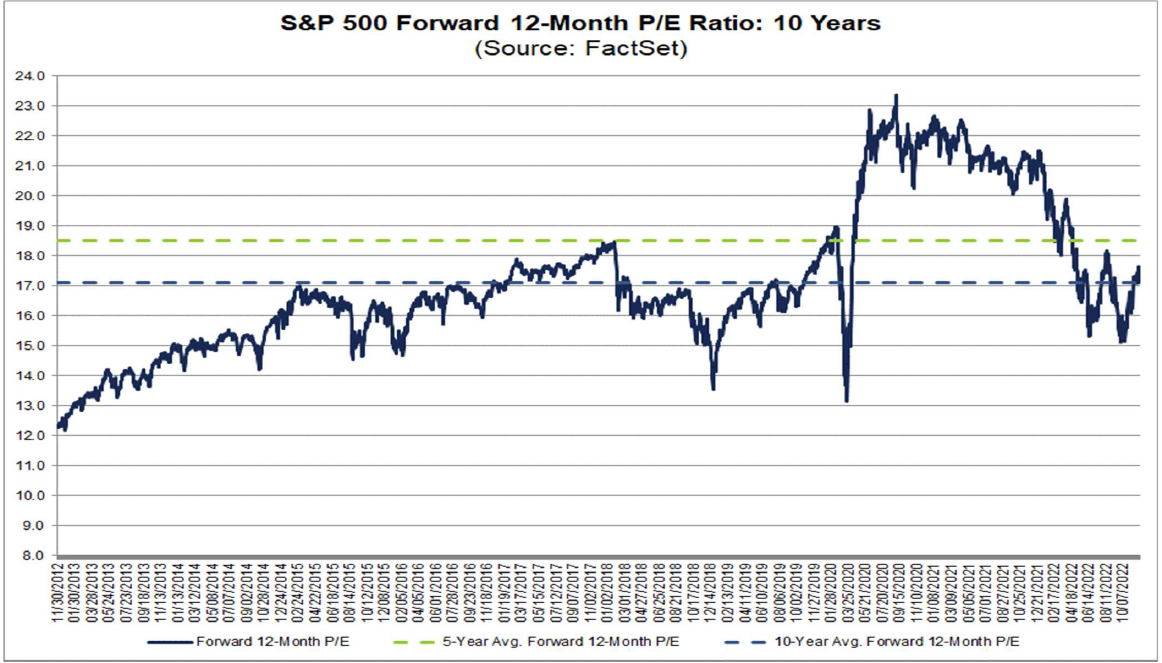
The dynamic price-earnings ratio (in the past 12 months) is 17.6, which is lower than the 5-year average of 18.5, but higher than the 10-year average of 17.1.
Generally speaking, under the influence of high cost and low demand, it is more and more common for US stock companies to "increase growth without increasing profits". The further slowdown in profits also further increases the probability of economic recession, but fortunately it has not deviated too far from expectations.
High cost and low demand
The net interest rate of all S&P 500 companies in Q3 is 11.9%, which is higher than the five-year average of 11.3%, but still lower than the 12.2% in Q2 and the 12.9% in the same period last year. From different sectors, the profit of the energy sector exceeded expectations by 10.2%, leading all industries with a net interest rate of 14.4%, much higher than last year's 8.9%; The net interest rate of the financial industry was 14.3%, down from 16.5% in the same period last year.

This round of inflation caused by energy has also continuously squeezed downstream industrial companies by high costs, so the profit margin has declined, and the cost reduction in the financial industry started in the second half of this year, which has not yet been reflected. After deducting the energy sector, the net profit rate in the third quarter has dropped to 10.3%, among which the net profit rate of software services, raw materials and media entertainment has also dropped rapidly.
In addition, some industries with low inventory have strong bargaining power and can withstand the pressure by raising prices, such as automobile and parts industries. Of course, these industries will still face the pressure of declining net interest rates after the demand falls next year.
The market is rewarding companies with stable profits and strong cash flow
The average price of Q3 companies whose earnings beat expectations rose by 2.4% from two days before the results to two days after the results. It is higher than the 5-year average increase of 0.9% in the same window; Meanwhile, QThe average price of companies whose earnings fell short of market expectations fell by 3.5% between the two days before the earnings release and the two days after the earnings release, which was worse than the five-year average decline of 2.2% during the same window.
In terms of growth quality, the non-financial ROE of Q3 S&P 500 decreased from 24.9% to 24.3% in Q2, while the non-financial and non-energy ROE continued to decline, from 23% in Q2 to 22.7% in Q3. From the cash flow statement, the issuance of credit bonds in Q3 slowed down, and the operating cash flow and cash in hand decreased, but the repurchase activities of enterprises declined and the capital expenditure rose.
Disclaimer: Investing carries risk. This is not financial advice. The above content should not be regarded as an offer, recommendation, or solicitation on acquiring or disposing of any financial products, any associated discussions, comments, or posts by author or other users should not be considered as such either. It is solely for general information purpose only, which does not consider your own investment objectives, financial situations or needs. TTM assumes no responsibility or warranty for the accuracy and completeness of the information, investors should do their own research and may seek professional advice before investing.
- Et1502·2022-12-13TFS InforLikeReport
- awspin·2022-12-12OkLikeReport
- Rick13·2022-12-12olLikeReport
- xebona·2022-12-12666LikeReport
- SarahLeo·2022-12-12LikeLikeReport
- Gerinit·2022-12-12okLikeReport
- Gracejul·2022-12-12ThksLikeReport
- Yvonnecpg·2022-12-12👍LikeReport