[Earnings season options strategy] Winning Big with Tech Earnings: Insider Strategies Revealed
This week, tech stocks will start reporting their earnings and things don't look good. According to data compiled by FactSet, S&P 500 companies are expected to have a 6.8% drop in earnings from the same time last year - the biggest drop since the second quarter of 2020 when the pandemic first hit.
As of April 4, e-mini futures contracts on the S&P 500, which bet on a decline in stocks, had grown to 321,459 contracts, the highest level since October 2011.
Still, equity strategists often view futures market positioning as a counter-indicator, meaning that stocks often move in the opposite direction from what futures traders expect, especially when positioning is clearly concentrated in one direction or the other. Of course, the past is no guarantee of future performance.
In terms of options strategy, technology stock’s earnings is considered a binary event because the stock will typically have a big move in either direction after announcing earnings. Traders can use options to trade a non-directional earnings move. Meaning they don't care about the direction of the stock move, just the magnitude of price movement. For non-directional traders, the important factor in the analysis is estimating the magnitude of the move in either direction and then trying to select the best option strategy around the estimated extent of that move.
For instance, let's say you have confidence that the earnings move is likely to be 3% or more in either direction but the at-the-money straddle is implying a move of 2%. The straddle, therefore, looks potentially undervalued and a good option strategy to trade. You can compare several option strategies against your estimate. Such as the strangle, butterfly, iron condor, ratio spreads etc..
$Netflix(NFLX)$
Netflix is scheduled to report earnings on 18-Apr-2023. The last time Netflix reported earnings on Jan 19, 2023, the stock increased by 8.46% to close at $342.5.
As you can see from the table below, NFLX shares have moved lower in the immediate aftermath of earnings 8 out of 12 previous reports. Based on the previous 12 earnings releases, NFLX is more likely to trade higher 1 day after earnings for an average gain of 0.5%. The absolute average return in the two weeks before earnings was ±5.4%. With an absolute average return of + / - 11% on earnings day.
How Non-Directional Option Strategies Have Performed Around Earnings:
The options market overestimated NFLX stocks earnings move 58% of the time in the last 12 quarters. The predicted move after earnings announcement was ±9.0% on average vs an average of the actual earnings moves of 11.0% (in absolute terms). This shows you that NFLX tended to be more volatile than the options market predicted for the earnings stock price reaction.
Strategy | Average Return | Win Rate |
Long Straddle | 31% | 42% |
Long Strangle | 64% | 33% |
Credit Iron Butterfly | -39% | 30% |
Credit Iron Condor | -6% | 58% |
Trade Ideas:
Historically the best performing earnings option play for NFLX was the Put Butterfly Spread with a 80% win rate (based on the last 10 quarters). The average strategy return was +60.1%.
The strategy of short 2x at-the-money puts, long 1 otm put, long 1 itm put-starting the Day of Earnings Trading and closing the position out Three Days After Earnings--has resulted in an average net return of +60.1% over the last10 earnings. It has been a winning strategy 8 of those times(80%).
$Tesla Motors(TSLA)$
Tesla is scheduled to report earnings on 19-Apr-2023. The last time Tesla reported earnings on Jan 25, 2023, the stock increased by 11% to close at $160.27.
As you can see from the table below, TSLA shares have moved lower in the immediate aftermath of earnings 7 out of 12 previous reports. The absolute average return in the two weeks before earnings was ±8.5%. With an absolute average return of ±5.3% on earnings day.
How Non-Directional Option Strategies Have Performed Around Earnings:
The options market overestimated TSLA stocks earnings move 75% of the time in the last 12 quarters. The predicted move after earnings announcement was ±8.4% on average vs an average of the actual earnings moves of 5.3% (in absolute terms).
Strategy | Average Return | Win Rate |
Long Straddle | -24% | 25% |
Long Strangle | -44% | 25% |
Credit Iron Butterfly | 16% | 60% |
Credit Iron Condor | 13% | 75 |
Trade Ideas:
Historically the best performing earnings option play for TSLA was the Buying 25-Delta Call with a 58% win rate (based on the last 12 quarters). The average strategy return was +172.8%.
The strategy of buying long 1 25-delta call -- starting One Day After Earnings and closing the position out Three Days After Earnings - has resulted in an average net return of +172.8% over the last 12 earnings. lt has been a winning strategy 7 of those times (58%)
$Microsoft(MSFT)$
Microsoft is scheduled to report earnings on 25-Apr-2023. The last time Microsoft reported earnings on Jan 25, 2023, the stock decreased by 0.6% to close at $240.61.
As you can see from the table below, MSFT shares have moved higher in the immediate aftermath of earnings 6 out of 12 previous reports. Based on the previous 12 earnings releases, MSFT is more likely to trade higher 1 day after earnings for an average gain of 0.6%. The absolute average return in the two weeks before earnings was ±4.6%. With an absolute average return of ±3.4% on earnings day.
How Non-Directional Option Strategies Have Performed Around Earnings:
The options prices predicted a ±5.0% post earnings move, compared to a -0.6% actual move. The options market overestimated MSFT stocks earnings move 69% of the time in the last 13 quarters. The predicted move after earnings announcement was ±4.6% on average vs an average of the actual earnings moves of 3.3% (in absolute terms).
Strategy | Average Return | Win Rate |
Long Straddle | -8% | 42% |
Long Strangle | -12% | 33% |
Credit Iron Butterfly | 8% | 42% |
Credit Iron Condor | 0% | 50 |
Trade Ideas:
Historically the best performing earnings option play for MSFT was the Credit Put Spread (S75P, L50P) with a 58% win rate (based on the last 12 quarters). The average strategy return was +52.1%.
The strategy of short 1 75-delta put, long 1 at-the-money put --starting the Day of EarningsTrading and closing the position out One Week AfterEarnings -- has resulted in an average net return of +52.1% over the last 12 earnings. lt has been a winning strategy 7 of those times (58%)
Bull Put Spread:
sell $MSFT 20230512 260.0 PUT$
$Alphabet(GOOG)$
Alphabet is scheduled to report earnings on 25-Apr-2023. The last time Alphabet reported earnings on Feb 2, 2023, the stock decreased by 3.3% to close at $105.22.
As you can see from the table below, GOOG historically moved higher heading into earnings more often than not. On average, the stock gained 2.0% for the 2 week period before earnings. GOOG shares have moved higher in the immediate aftermath of earnings 7 out of 12 previous reports. The absolute average return in the two weeks before earnings was ±4.9%. With an absolute average return of ±5.2% on earnings day.
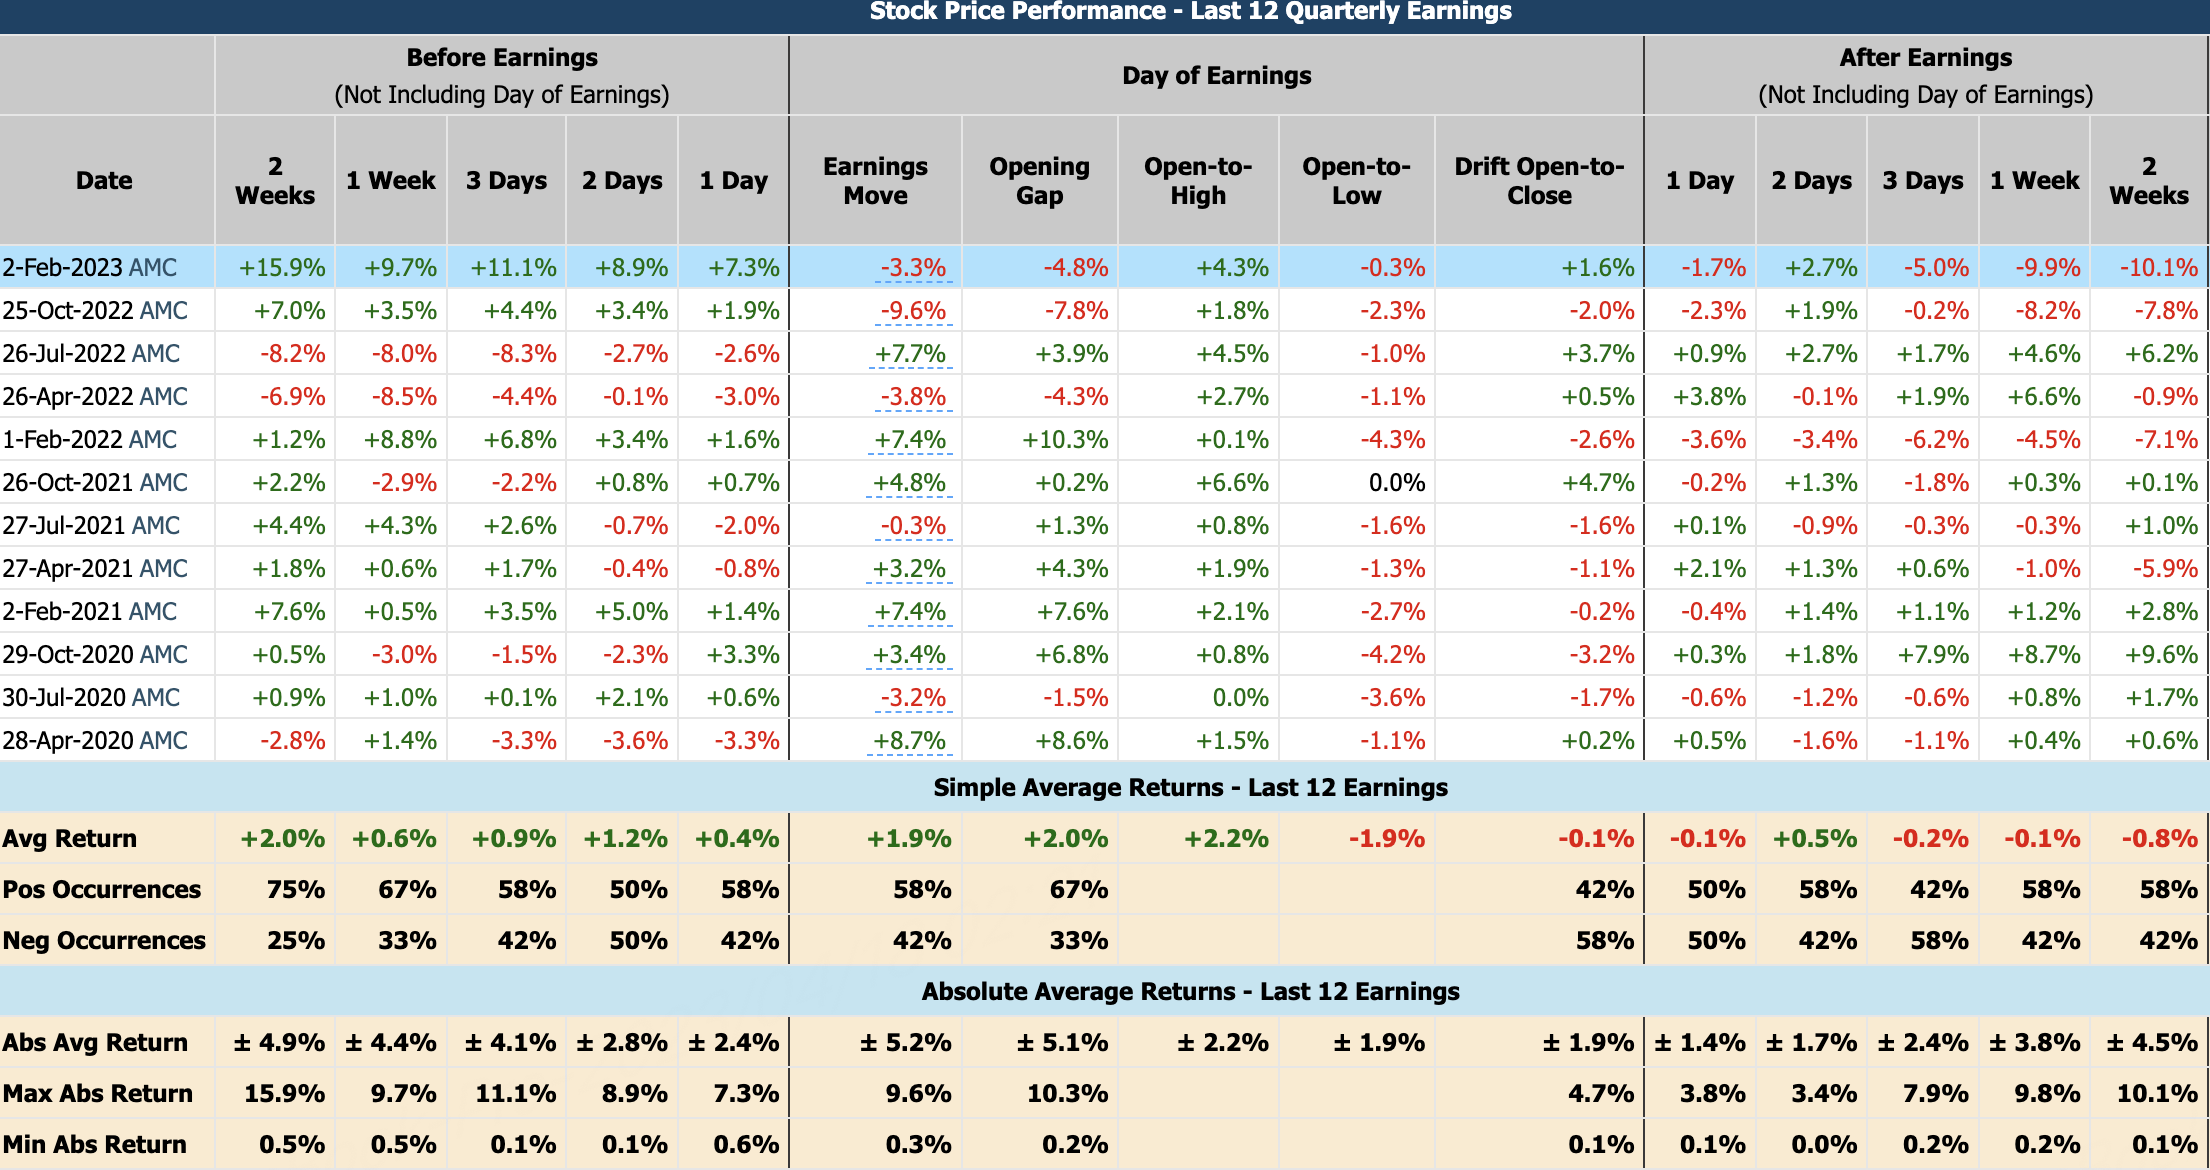
How Non-Directional Option Strategies Have Performed Around Earnings:
The options prices predicted a ±7.3% post earnings move, compared to a -3.3% actual move. The options market overestimated GOOG stocks earnings move 54% of the time in the last 13 quarters. The predicted move after earnings announcement was ±5.4% on average vs an average of the actual earnings moves of 5.0% (in absolute terms).
Strategy | Average Return | Win Rate |
Long Straddle | 2% | 50% |
Long Strangle | -12% | 42% |
Credit Iron Butterfly | -43% | 18% |
Credit Iron Condor | 3% | 50% |
Trade Ideas:
Historically the best performing earnings option play for GOOG was the Credit Put Spread (S50P, L25P) with a 67% win rate (based on the last 12 quarters).
The strategy of short 1 at-the-money put, long 1 25-delta put - starting the Day of Earnings Trading and closing the position out Two Days After Earnings -- has resulted in an average net return of +1660.4%over the last 12 earnings. lt has been a winning strategy 8 of those times (67%).
Bull Put Spread:
$Meta Platforms, Inc.(META)$
Alphabet is scheduled to report earnings on 26-Apr-2023. The last time Alphabet reported earnings on Feb 1, 2023, the stock increased by 23.3% to close at $188.77.
As you can see from the table below, META shares have moved lower in the immediate aftermath of earnings 7 out of 12 previous reports. Based on the previous 12 earnings releases, META is more likely to trade lower 1 day after earnings for an average loss of -1.0%. The absolute average return in the two weeks before earnings was ±6.3%. With an absolute average return of ±11.2% on earnings day.
How Non-Directional Option Strategies Have Performed Around Earnings:
The options prices predicted a ±9.0% post earnings move, compared to a +23.3% actual move. The options market overestimated META stocks earnings move 38% of the time in the last 13 quarters. The predicted move after earnings announcement was ±7.5% on average vs an average of the actual earnings moves of 10.8% (in absolute terms). This shows you that META tended to be more volatile than the options market predicted for the earnings stock price reaction.
Strategy | Average Return | Win Rate |
Long Straddle | 41% | 50% |
Long Strangle | 85% | 42% |
Credit Iron Butterfly | -49% | 25% |
Credit Iron Condor | -30% | 45% |
Trade Ideas:
Historically the best performing earnings option play for META was the Buying 25-Delta Strangle with a 58% win rate (based on the last 12 quarters).
The strategy of long 1 25-delta call, long 1 25-delta put --starting Three Days Before Earnings and closing the position out the Day of Earnings Trading -- has resulted in an average net return of+111.4% over the last 12 earnings. lt has been a winning strategy 7 of those times(58%)
$Amazon.com(AMZN)$
Amazon is scheduled to report earnings on 27-Apr-2023. The last time Amazon reported earnings on Feb 2, 2023, the stock decreased by 8.4% to close at $103.39.
As you can see from the table below, AMZN shares have moved lower in the immediate aftermath of earnings 9 out of 12 previous reports. Based on the previous 12 earnings releases, AMZN is more likely to trade lower 1 day after earnings for an average loss of -0.5%. The absolute average return in the two weeks before earnings was ±5.9%. With an absolute average return of ±6.8% on earnings day.
How Non-Directional Option Strategies Have Performed Around Earnings:
The options prices predicted a ±9.1% post earnings move, compared to a -8.4% actual move. The options market overestimated AMZN stocks earnings move 46% of the time in the last 13 quarters. The predicted move after earnings announcement was ±5.7% on average vs an average of the actual earnings moves of 6.9% (in absolute terms). This shows you that AMZN tended to be more volatile than the options market predicted for the earnings stock price reaction.
Strategy | Average Return | Win Rate |
Long Straddle | 19% | 50% |
Long Strangle | 37% | 50% |
Credit Iron Condor | -24% | 50% |
Trade Ideas:
Historically the best performing earnings option play for AMZN was the Debit Put Spread (L25P, S15P) with a 67% win rate (based on the last 12 quarters).
The strategy of long 1 25-delta put, short 1 15-delta put --starting the Day Before Earnings Trading and closing the position out Two Days After Earnings -- has resulted in an average net return of +76.3% over the last 12 earnings. lt has been a winning strategy 8 of those times (67%)
$Apple(AAPL)$
Amazon is scheduled to report earnings on 4-May-2023. The last time Amazon reported earnings on Feb 2, 2023, the stock increased by 2.4% to close at $154.5.
As you can see from the table below, AAPL shares have moved lower in the immediate aftermath of earnings 7 out of 12 previous reports. Based on the previous 12 earnings releases, AAPL is more likely to trade lower 1 day after earnings for an average loss of -0.2%. The absolute average return in the two weeks before earnings was ±4.3%. With an absolute average return of ±4.0% on earnings day.
How Non-Directional Option Strategies Have Performed Around Earnings:
The options prices predicted a ±4.4% post earnings move, compared to a +2.4% actual move. The options market overestimated AAPL stocks earnings move 69% of the time in the last 13 quarters. The predicted move after earnings announcement was ±4.5% on average vs an average of the actual earnings moves of 3.9% (in absolute terms).
Strategy | Average Return | Win Rate |
Long Straddle | -6% | 33% |
Long Strangle | -14% | 25% |
Credit Iron Butterfly | -23% | 40% |
Credit Iron Condor | -5% | 56% |
Trade Ideas:
Historically the best performing earnings option play for AAPL was the Credit Put Spread (S75P, L50P) with a 58% win rate (based on the last 12 quarters).
The strategy of short 1 75-delta put, long 1 at-the-money put --starting One Day After Earnings and closing the position out One Week After Earnings -- has resulted in an average net return of +35.9% over the last12 earnings. lt has been a winning strategy 7 of those times (58%)
Bull Put Spread
Disclaimer: Investing carries risk. This is not financial advice. The above content should not be regarded as an offer, recommendation, or solicitation on acquiring or disposing of any financial products, any associated discussions, comments, or posts by author or other users should not be considered as such either. It is solely for general information purpose only, which does not consider your own investment objectives, financial situations or needs. TTM assumes no responsibility or warranty for the accuracy and completeness of the information, investors should do their own research and may seek professional advice before investing.
Great ariticle, would you like to share it?
Great ariticle, would you like to share it?
Earnings, earnings, earnings. Good strategy to learn!
Great ariticle, would you like to share it?
Great ariticle, would you like to share it?
Great ariticle, would you like to share it?
Great ariticle, would you like to share it?
Great ariticle, would you like to share it?
Win BiG Big ...
Sharing