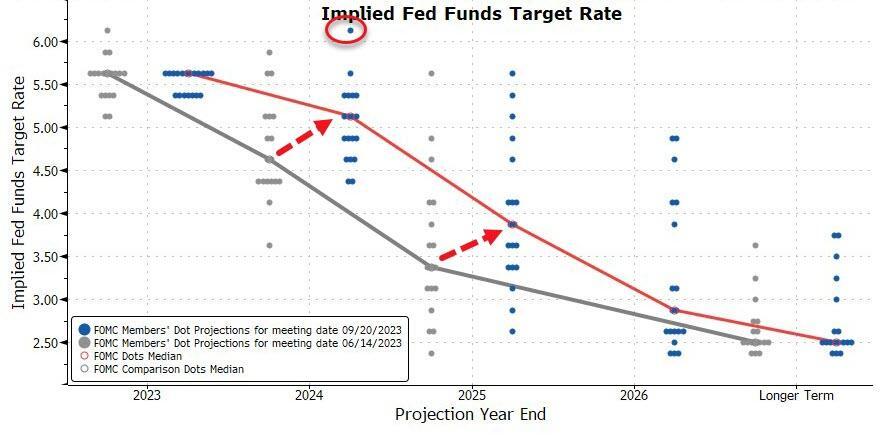
After FOMC Sep. meeting, dot plot has changed, which further propelled the US bond to rise to 4.5%. $iShares 20+ Year Treasury Bond ETF(TLT)$
Fed dot plot did not raise the endpoint for rate hikes, but it postponed the timing and frequency of rate cuts, which is more dovish than the market expected.

Term premiums (compensation for holding long-term government bonds) are the main contributor to the upward pressure on interest rates, rather than interest rate expectations, also indicating that the market does not fully agree that there will be another rate hike within the year according to the dot plot, but it is concerned about the uncertainty of the path.
Although the uncertainty about the future rate cut path is far from realization, the short-term impact of supply factors is already sufficient.
Well, How much interest rate hike has assets been factored into?
Federal Reserve's dot plot
It implies a net rate cut of 1 time by the end of 2024. The September dot plot indicates one more rate hike within the year, and the implied number of rate cuts by the end of 2024 has decreased from 4 times to 2 times, implying a total rate cut of 27.5 basis points by the end of 2024.
Interest Rate Futures
Implied net rate cuts of 1.6 times in the next year, looser than the Federal Reserve dot plot. Current interest rate futures imply a 2023 endpoint for rate hikes at 5.5%, with interest rates at 5% in September 2024. Over the next year, there is a net expected rate cut of 1.6 times compared to the current Federal Funds Rate level, which is a decrease from the rate cut expectations before the September FOMC meeting (39.5bp vs. 44.8bp). The specific path implied by CME interest rate futures suggests that rate cuts will be delayed until July 2024, followed by rate cuts again in November and December 2024.
In other words, interest rate futures indicate a low likelihood of further rate hikes during the year, while rate cuts are expected to begin around the middle of next year.
Treasury
Short-term U.S. Treasury Bonds imply approximately 0.3 rate hikes in the next year, while long-term U.S. Treasury Bonds may have already overreacted. The current 1-year U.S. Treasury Bonds imply an increase of 7.6 basis points in the next year, which is not significantly different from the 1.7 basis points before the September FOMC meeting.
The possibility of further rate hikes within the year has not been factored in. Long-term U.S. Treasury Bonds briefly surpassed 4.5%, reaching a new high since March 2007, and the RSI indicator is approaching oversold levels. $Micro 10-Year Yield - main 2309(10Ymain)$ $iShares 20+ Year Treasury Bond ETF(TLT)$ $iShares 0-3 Month Treasury Bond ETF(SGOV)$ $iShares Short Treasury Bond ETF(SHV)$
Stocks
It Implies a net rate cut of 5.1 times in the next year, with more rate cut expectations included. Based on the relationship between the dynamic valuation of US stocks, the dynamic dividend yield, and the nominal US bond interest rate, the current S&P 500 index's dynamic valuation of 18.25 times implies a 10-year US bond interest rate of 3.27%, corresponding to a net rate cut of 126 basis points in the next year. $S&P 500(.SPX)$ $NASDAQ(.IXIC)$ $Invesco QQQ Trust-ETF(QQQ)$
Gold
It implies a net cut in interest rates of 3.2 times over the next year, with an overall bias towards rate cuts. Based on the relationship between real interest rates, the US dollar, and gold, we calculate that the current gold price (~$1925 per ounce) implies a real interest rate of 1.4%, significantly lower than the current actual level of 2.1%, corresponding to a rate cut of 79 basis points over the next year, which is higher than what is priced into interest rate futures. $Gold - main 2312(GCmain)$ $SPDR Gold Shares(GLD)$
Comments
Government shutdown is good for the markets & the FED ! The "bad news" is priced in for the moment ! Significantly worsening corporate earnings & economic conditions will move the markets much lower but that is probably an early 2024 event !
The topping of the overall market is a necessary ingredient to increasing demand for gold and gold mining stocks. I think fed actions surely creates such a stock market top.
If I was going to do a 2 etf portfolio it would be qqq and schd. Go take a look. You might find that is what you want.
Gold stands tall against hawkish fed poised for new records. Gold is well-positioned for when the Fed breaks something
这篇文章不错,转发给大家看看
Buy gold all you can now... Its up in a big down market...