Key Points:
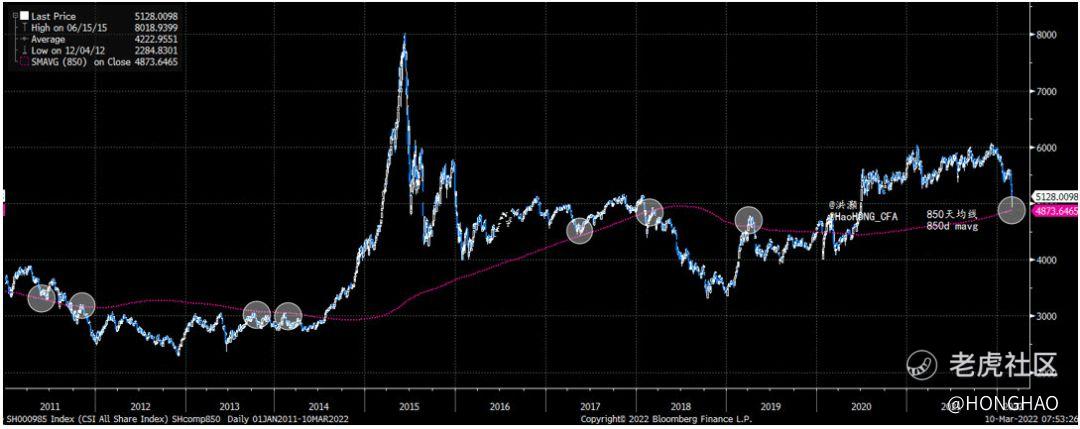
- The Shanghai Composite staged a dramatic intra-day reversal right at its 850day moving average, an important secular market trend line moving in tandem with China’s economic short cycle.
- The nadir of the Shanghai Composite during yesterday’s trading was at 3,157; the peak last December was 3,709. This range is consistent with our forecast trading range of between just below 3,800 and just below 3,200 laid out in our 2022 outlook last November.
- China’s market is going through a growth scare. The positive news from Ukraine helps. For now, we should have a technical reprieve from these technically significant levels.
The Shanghai Composite staged a dramatic intra-day reversal yesterday. The reversal happened as suddenly as the plunge right after the trading lunch break. After lunch, the SHCOMP plunged almost 5% from its intraday peak before recovering, and the CSI All-A index tumbled even more by more than 5% at its steepest decline. Traders were dumbfounded, scrambling to cut loss first and then trying to catch a breath to explain what the cause of the sudden sell-off would be.
Of course, these days, many would point to the state fund’s intervention if there is an unexplained intraday move in the market. It was convenient to draw such allusion yesterday, as the PBoC was reported to submit one trillion yuan of its retained earnings to the Finance Ministry as part of the fiscal budget of 2022. In our Monday report titled “Schrödinger’s Nuclear Bomb”, we highlighted that this year’s fiscal deficit was actually going to be higher than on paper of 2.8%, as state entities remit some of their retained earnings as part of the budget. These submissions could amount to more than 1% of fiscal deficit spending to ensure the GDP growth target of 5.5%.
But something else interesting happened during trading yesterday. The SHCOMP plunged to its 850-day moving average, and then reversed course (Figure 1). Since 2016, we have pioneered in quantitative study of China’s economic cycle, and have been applying our economic cycle theory to macro strategy. The calculation period of the 850day moving average is the same wave length of 3.5 years, the timespan of an economic short cycle in China. It is not technical analysis.
Figure 1: Shanghai Composite’s dramatic intra-day reversal right at 850-day mavg

We must emphasize that this long-term moving average only suggests important levels for traders to watch. It shows the secular trend of the market indices, and how they move in tandem with the economic cycle. It has been consistently coinciding with many inflection or important points in the history of SHCOMP, as well as other major market indices.
Since our publication of our papers on China’s economic cycle and its applications in market analysis, the 850-day average has rapidly become one of the most watched technical indicators for Chinese traders. And the more attention the average is able to draw, the more significant it will be.
But then why the sudden plunge?
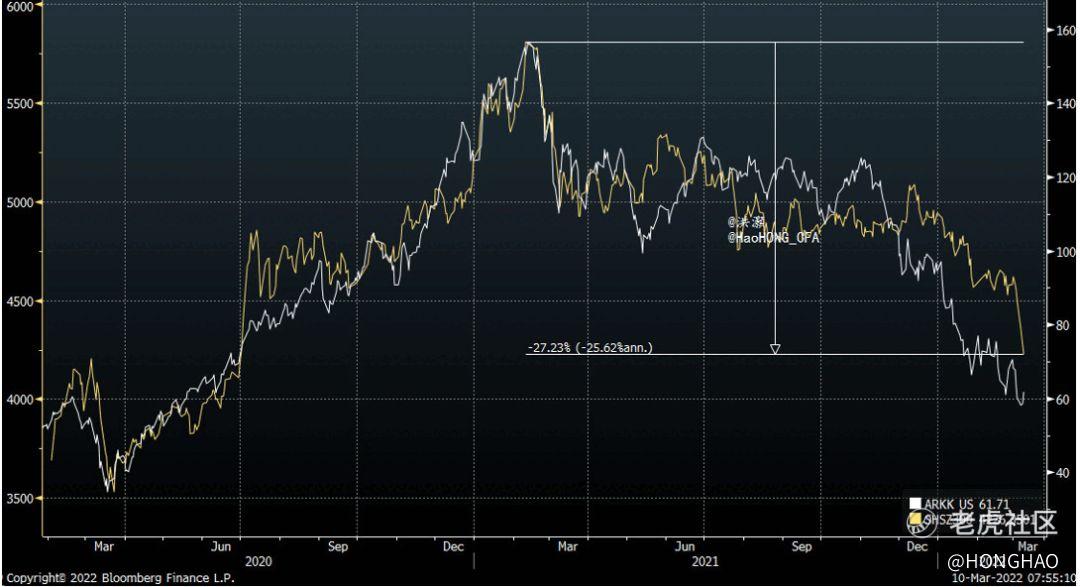
We believe the Chinese market is going through a “growth scare”. The CSI300 is showing very close correlation with Ark Innovation ETF, the prominent growth funds led by Cathie Woods (Figure 2). Such close correlation between two indices that are a world apart suggests that both are being swayed by the similar macroeconomic factors.
While the “Twin Sessions” has laid down an ambitious growth target for 2022, it is not with challenges. Most importantly, the implied message from weaving various detailed discussion together in the budget suggests that China’s macro leverage will remain stable. In our Monday report “Schrödinger’s Nuclear Bomb”, we have demonstrated how Chinese stock performance has been closely correlated with macro leverage. Yesterday there were some more discussions from the regulators clarifying the point to keep the macro leverage steady in 2022 – before lunch trading. It may well be the reason for yesterday’s plunge.
But then some positive development from the Ukraine war front about Ukraine was paving the way to negotiation must have helped sentiment to stage the reversal. Not the state fund.
Figure 2: CSI300 vs ARKK – a growth scare

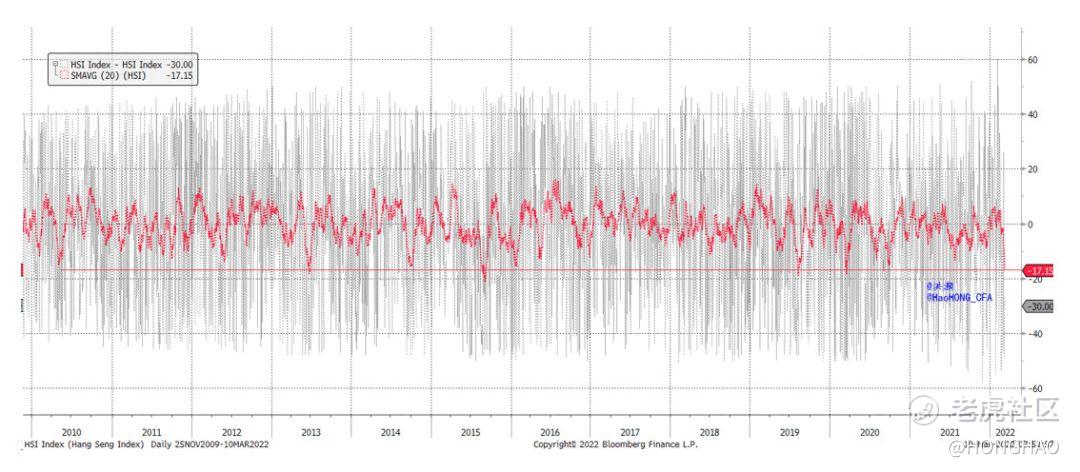
In sum, both on and offshore markets are very oversold. The oversold intensity in the Hang Seng is comparable to the selloff in the depth of the pandemic in March 2020, and many other traumatic episodes that the Hang Seng has seen in the past decade (Figure 3). In our 2022 outlook published last November, we pegged the trading range for the SHCOMP for the next twelve months to be between just below 3,200 and just below 3800, with the worst case to be just below 3,000. Now There should be at least a bounce from these important technical levels. As the outlook in Ukraine clears, the focus of the market will be back to the conflicts of the economic cycles between China and the US.
Figure 3. The Hang Seng is very technically oversold as well in the near term


Comments