S&P 500: Recession To Hit Right Before The Election
Summary
- ISM Services for April shows contraction in the U.S. service sector, a key driver of the economy, while the U.S. economy added fewer jobs than expected.
- Based on this data, the U.S. economy is likely slipping into a recession in Q3 2024.
- Thus, S&P 500 is facing a recessionary bear market, which could be brutal as the mega-cap tech bubble burst.
LilliDay
An imminent recession
The labor market report for April showed that the U.S. economy added only 175K new jobs, which was well below the expectations of 245K. This data, on the surface, points to a slowing U.S. economy.
But more importantly, the ISM Services for April came at 49.4, which indicates that the U.S. service sector is contracting. This was completely unexpected by the market, as the consensus expectation was 52.
This is important because the service sector remained resilient due to the strong consumption, which accounts for 70% of the U.S. economy.
Thus, it appears that the U.S. economy is slipping into a recession.
The recent forecast by ING, which is dated April 25th, predicts that the U.S. Q3 GDP growth rate would be at 0% in Q3 and 0.6% in Q4. This forecast was published before the recent unexpected weak data, and, thus, it's likely to be revised to a negative number.
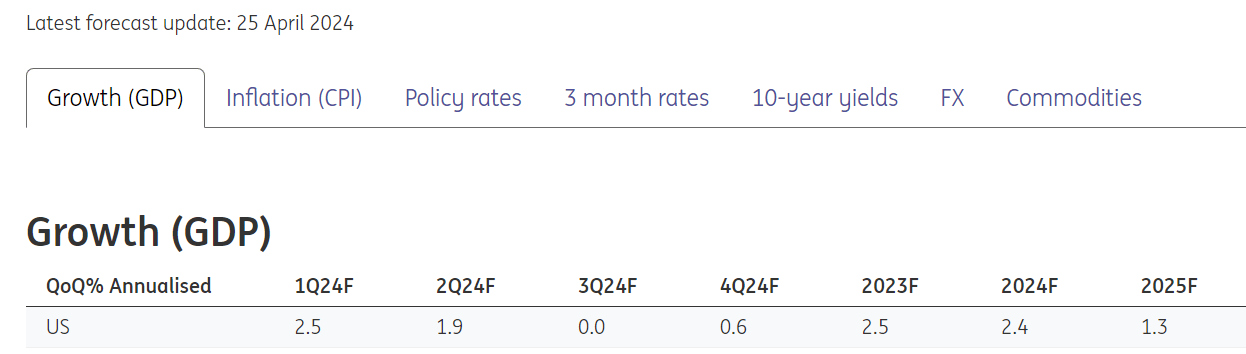
ING Forecast
The macro context
What is the reason behind an imminent recession? First, it's important to understand the macro context.
Based on a normal business cycle, once high inflation becomes unsustainable, the Fed is forced to increase the short-term interest rates above the long-term interest rates to invert the yield curve.
An inverted yield curve creates a restrictive macro environment where credit availability is reduced, particularly to more financially vulnerable firms, which eventually results in less investment and higher unemployment. In addition, higher credit costs reduce credit consumption, which also reduces investment and causes a higher unemployment rate.
Thus, an inverted yield curve generally precedes a recession. However, the effect of the inverted yield curve on the economy has "long and variable lags". This means that it takes time for the yield curve to actually affect the real economy. Generally, a recession occurs 12–18 months after the yield curve initially inverts.
However, the findings show that a deeper and longer inversion of the yield curve produces a deeper and longer recession. The chart below shows the difference between the 10Y Treasury yield (US10Y) and the 3-month Treasury Bill yield (US3M) - that's the yield curve. During the current cycle, we have a record deep inversion, and a record long inversion. Based on this observation, an inevitable recession should be deeper and longer than usual.
So, that's the macro reason behind the expectations of an imminent recession.
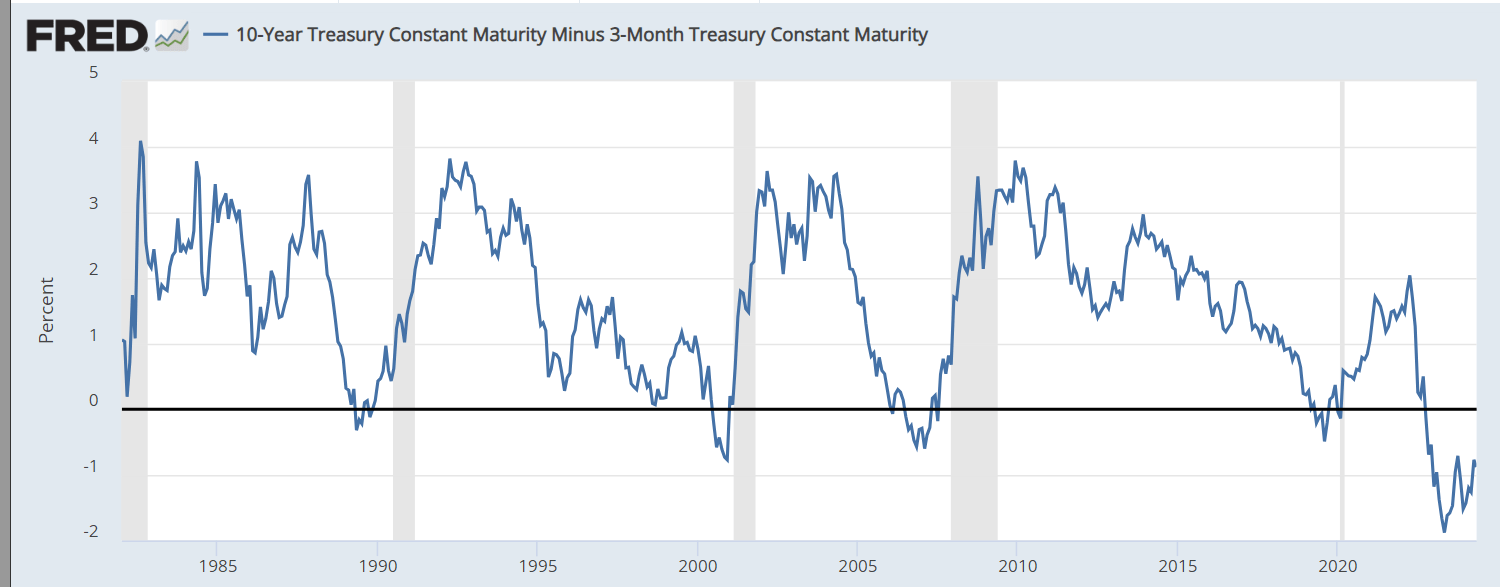
FRED
The ISM Services PMI report for April
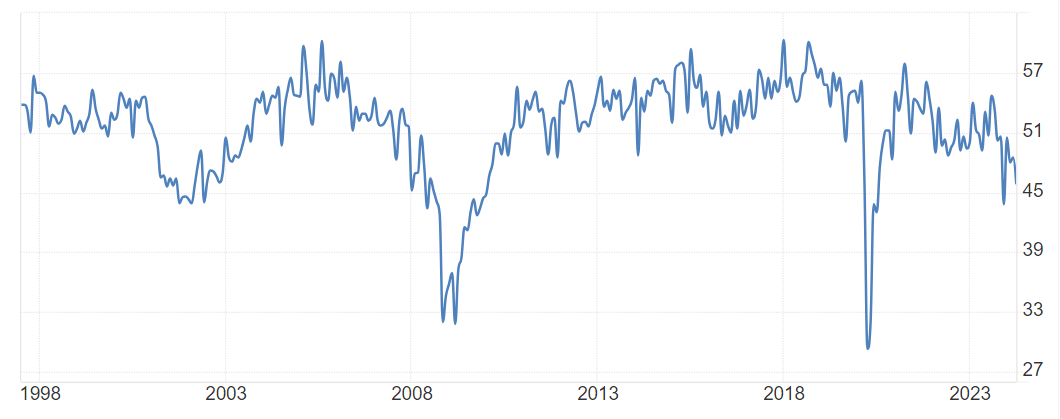
The ISM Services PMI report for April came at 49.4. That indicates that the U.S. service sector is in contraction. Here is the historical chart of the ISM Services. The number turned below 50 during the 2000-2003 recession, 2008-2009 recession, and 2020 Covid shock.
The number was briefly below 50 in December 2022, and this was the time when the Fed was actually predicting a mild recession. But during the entire recent cycle, the number was steady just above 50. If, in fact, the number continues to fall and stays below 50, that would signal a recession.
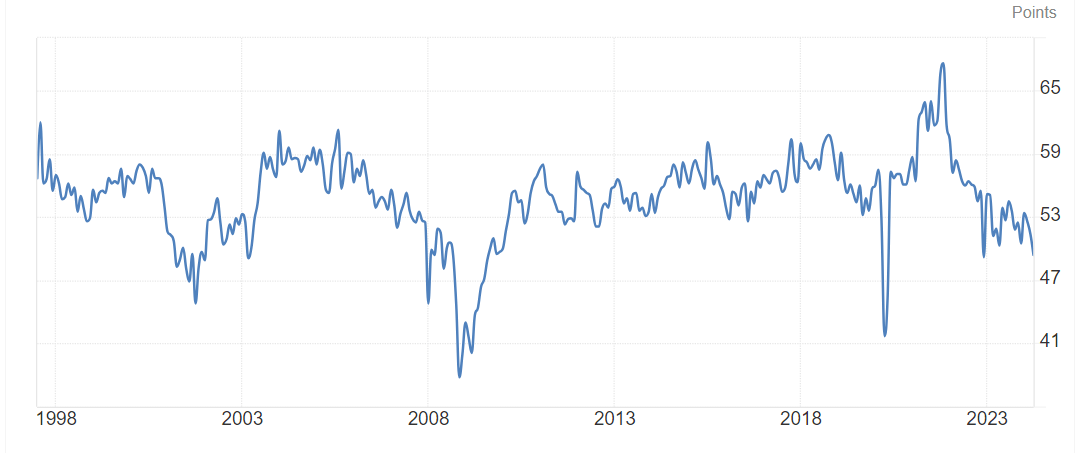
Trading Economics
What's driving the ISM Services PMI in contraction? It's the employment. The ISM Services Employment part came at 45.9, and it was expected to come at 49, so that's a big miss. This signals that firms in the service sector are actually reducing the number of employees.
The chart below shows that ISM Services Employment goes below 50 during the recession. During the recent cycle, the ISM Employment has been just above 50, dipping below 50 in 2022 when the Fed started to hike interest rates, and dipped to 43 in December 2023. Given the current level, the ISM Services indicated that job losses in the service sector are forthcoming, and with that, a recession.
Trading Economics
The April Labor report
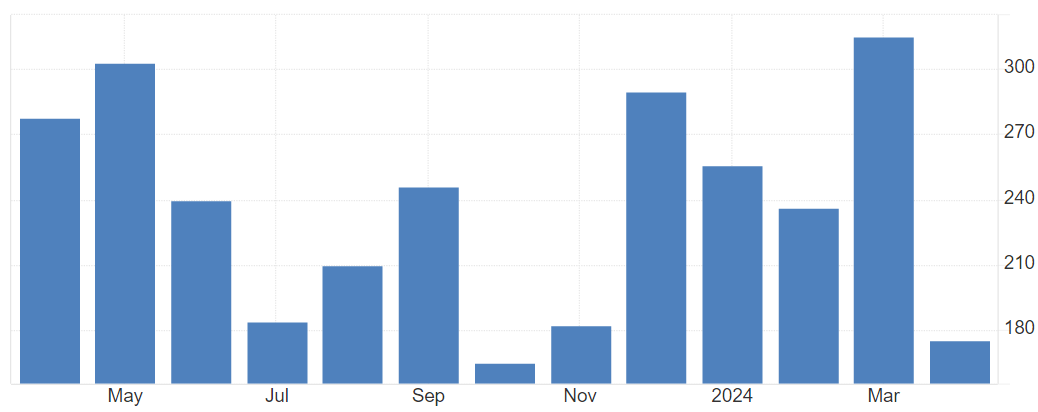
The April labor report also came much weaker than expected. The market consensus was for 245K new jobs created, while the actual number came at 175K new jobs created, with an increase in the unemployment rate from 3.8% to 3.9%.
However, this "weakness" in the labor market is not as clear because the major miss in the expectations was the government jobs. Specifically, the government created 8K new jobs, which is well below the recent level of 50-90K jobs. Thus, if you exclude government jobs, the new job creation was as expected in April.
Still, the 175K reading is the second lowest over the last 12 months. Here is the chart.
Trading Economics
During the recent cycle, the U.S. labor market has been resilient mainly to job creation in Health Care and Social Services, Retail, and Government.
During the month of April, the Health Care and Social Services sector created 95K new jobs (out of 175K). The strength in this sector is not cyclical, it's structural, due to demographics. Wholesale retail, retail trade and warehousing added a combined 50K. That's basically a very narrow job creation.
But it looks like the government jobs are gone. Why are government jobs disappearing, right before the election, and slowing job creation? That's something to follow in the next report.
Implications
Obviously, the key implication for the stock market is that a recession usually produces a recessionary bear market, which could be a very deep 50%+ drawdown like in 2001 and 2008, or a minor 20% correction like in 1991.
Given that currently S&P 500 Index (SP500) trades at the inflation adjusted P/E-10 ratio of 33 (that's Shiller P/E ratio), the stock market is a borderline bubble. The recent spike in price and valuation has been led by the mega-cap tech stocks (QQQ) under the GenAI theme. The recent earnings season shows that only the cloud-based business is providing growth for Microsoft (MSFT), Alphabet (GOOGL) (GOOG) and Amazon (AMZN), which is simply not broad enough to sustain the rally, but it opens the possibility for a bubble burst. In fact, Apple (AAPL) has negative revenue growth already, and it's still trading at a high valuation. Thus, it is likely that the forthcoming recessionary bear market will be deeper, more on par with 2001 and 2008, as the mega-cap tech bubble burst.
The Fed is in a "higher-until-recession" mode, and the Fed will start cutting as the preliminary evidence of the recession deepens. This is consistent with the normal cycle. The Fed will not be able to engineer a soft-landing. The ISM Services Prices came at 59.2, well above expectations, which signals that we are, in fact, facing an inflationary recession - thus, the Fed will not be able to prevent the recession by cutting preemptively.
Additionally, the slowdown is starting in an election year, with a recession expected to hit right before the U.S. election in November. This is actually a similar situation to 2008. The question is whether the sitting government will re-start hiring to delay the recession, potentially. Also, whether the Fed will take this as an opportunity to cut in June/July to boost the markets, and delay the recession.
Disclaimer: Investing carries risk. This is not financial advice. The above content should not be regarded as an offer, recommendation, or solicitation on acquiring or disposing of any financial products, any associated discussions, comments, or posts by author or other users should not be considered as such either. It is solely for general information purpose only, which does not consider your own investment objectives, financial situations or needs. TTM assumes no responsibility or warranty for the accuracy and completeness of the information, investors should do their own research and may seek professional advice before investing.
- William85·05-07Great analysis!LikeReport