What is the profit from US Treasury?
Market Background
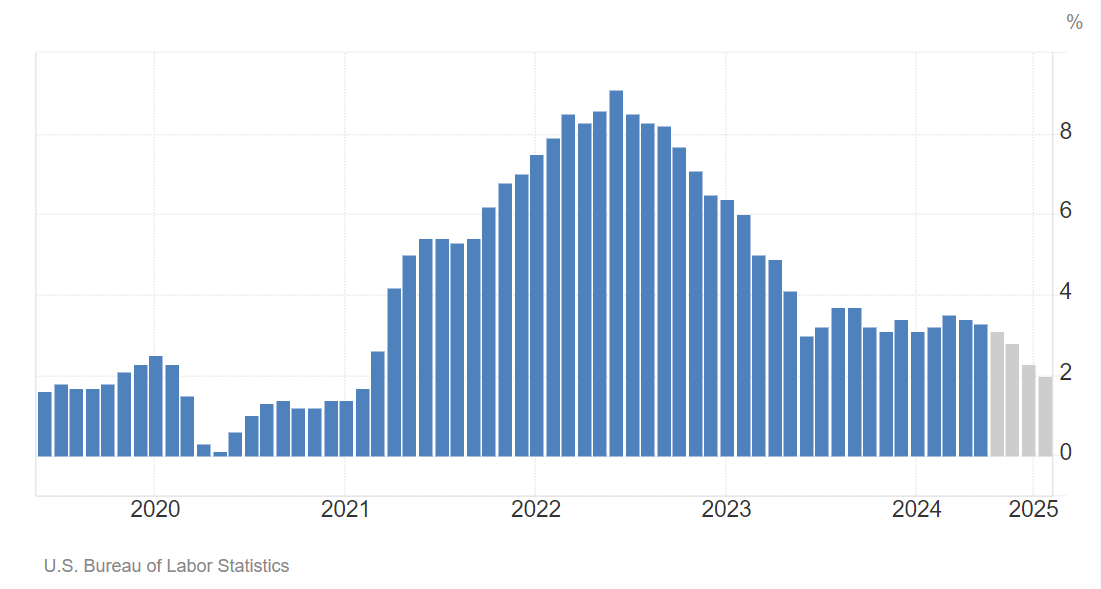
The U.S. CPI rose 3.3% year-on-year in May, and the core CPI rose 3.4% year-on-year, both lower than the previous value and market expectations. This suggests that inflationary pressures have eased and market expectations of a Fed rate cut have strengthened. Nonetheless, the Fed chose to stay put at the June FOMC meeting, but the dot plot shows that Fed officials expect the number of rate cuts to be reduced from three to one this year. This hawkish signal to some extent dampened the market's expectations of rate cuts.
Trend Analysis of U.S. Treasury Yields?
The measurement of U.S. bond rates should not only take into account traditional interest rate expectations and term premiums, but also focus on the equilibrium relationship between the cost of financing and the return on investment. $iShares 20+ Year Treasury Bond ETF(TLT)$ $Direxion Daily 20 Year Plus Treasury Bull 3x Shares(TMF)$ $Direxion Daily 20 Year Plus Treasury Bear 3x Shares(TMV)$
Specifically:
Overall Economic Level, the following factors need to be considered for U.S. bond rate measurement:
Real Interest Rate Expectations: The market currently expects real interest rates to return to the level of the natural rate (about 1.3%).
Inflation expectations: Inflation is expected to be between 2.2% and 2.5%.
Maturity premium: The term premium is around 0-30bp.
The combination of these factors puts the pivot of the 10-year U.S. bond rate at about 4%.
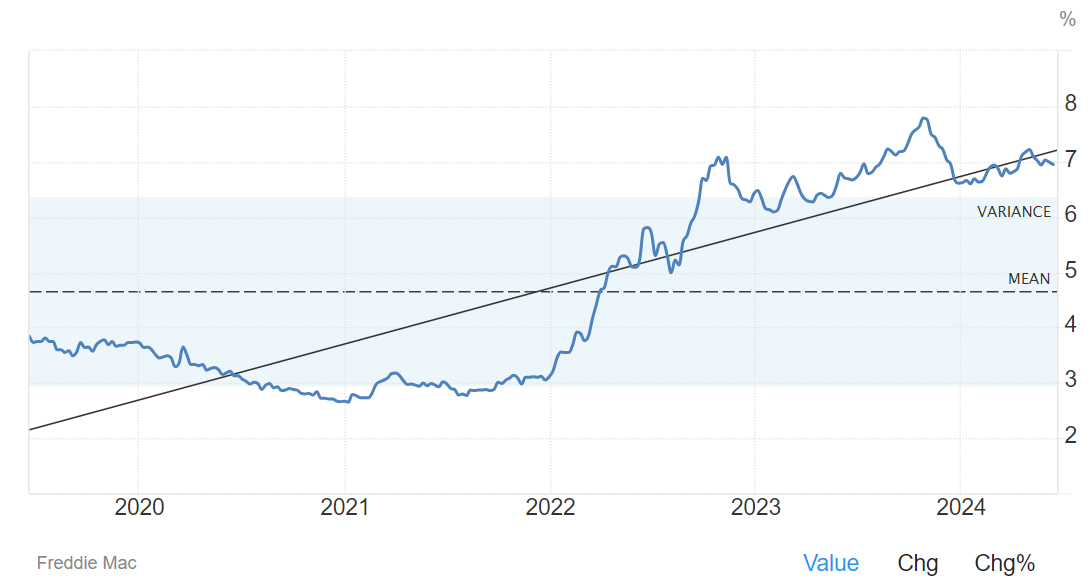
Residential sector: Home mortgage rates are highly correlated with the 10-year U.S. bond rate. If mortgage rates need to fall back to near the rental rate of return (6.7%), the corresponding 10-year U.S. bond rate needs to fall to 4.2%.
Corporate Sector: Commercial and industrial lending rates are highly correlated with the 10-year U.S. bond rate. If corporate lending rates need to fall back to parity with ROIC (5.9%), the corresponding 10-year U.S. bond rate needs to fall to 4.1%.
Prospects for rate cuts and Fed policy outlook
Based on the above measurements, the Fed may need to cut rates by 100~125bp to stabilize the 10-year US bond rate at around 4%. this is consistent with the rate cuts projected in the dot plot of the June FOMC meeting. However, overtrading in the market and changes in expectations could lead to an adjustment in the actual rate cut.
The growth-inflation trade-off: Current CPI data suggests that inflationary pressures have eased, which provides the Fed with room to cut rates to support economic growth. Lower inflation expectations reduce the need for tightening.
Fed's policy stance: Although the Fed left interest rates unchanged at its June meeting, most officials in the dot plot projected a reduction in the number of rate cuts in 2024 from three to one, indicating a careful balance between preventing the economy from overheating and controlling inflation. Given the risks of easing inflation and an economic slowdown, a rate cut remains more likely.
The restraint exercised at the June meeting suggests that the Fed is reserving space for future rate cuts while ensuring that the economy does not experience sharp swings.
Asset Allocation Strategy
Under the current market environment, there is still room to maneuver in the interest rate cut trade, but due to the limited magnitude of the rate cut and the market has reacted in advance, it is necessary to operate with caution. In the coming period, U.S. bond rates may fluctuate between 4.2% and 4.7%, and may fall below 4% and gradually rebound after the rate cut is realized.
Fixed-income assets and gold may benefit in a rate-cutting cycle, and investors may increase their allocations to these assets. $SPDR Gold Shares(GLD)$ $Barrick Gold Corp(GOLD)$
In addition, focusing on reflation-benefiting assets such as commodities and cyclical equities can help diversify risk and capture returns. $WTI Crude Oil - main 2408(CLmain)$ $United States Oil Fund LP(USO)$
Summary
Based on the analysis of the new framework of financing cost and return on investment, the Fed may still need to cut interest rates by 100~125bp in the future in order to achieve the balance of the interest rate curve and a smooth transition of the economy. The market needs to operate cautiously in this process and adjust investment strategies in a timely manner to cope with possible volatility and changes.
$S&P 500(.SPX)$ $SPDR S&P 500 ETF Trust(SPY)$ $Invesco QQQ(QQQ)$ $NASDAQ(.IXIC)$ $ProShares UltraPro QQQ(TQQQ)$
Disclaimer: Investing carries risk. This is not financial advice. The above content should not be regarded as an offer, recommendation, or solicitation on acquiring or disposing of any financial products, any associated discussions, comments, or posts by author or other users should not be considered as such either. It is solely for general information purpose only, which does not consider your own investment objectives, financial situations or needs. TTM assumes no responsibility or warranty for the accuracy and completeness of the information, investors should do their own research and may seek professional advice before investing.
- fluffik·06-17Perfect analysis! [Like]LikeReport
- MoiraHorace·06-17Awesome analysisLikeReport


