Continuing Prep for Next Week's Pullback, Watch for Low Probability Slide on Friday
I have some good news and bad news: The bad news is that we're only halfway through this selloff, with another potential 2% downside for the broad market.
The good news is that even though we're just halfway, individual stocks have already seen significant pullbacks, leaving ample room for upside following earnings releases and setting expectations that price reactions may not be overly negative.
Let's start with the market overview. Wednesday's plunge saw a rare put-buying frenzy. For those who bought puts ahead of the move, the decision was:
A) Take profits
B) Roll down to lower strike puts
Dealers opted for (B), rolling out of higher strikes to position for further downside:
Closing Sept 20 526 puts, rolling to Sept 20 522 puts
Closing July 31 535 puts, rolling to July 31 510 puts
Closing Aug 16 520 puts, rolling to Aug 16 515 puts
Closing Aug 16 530 puts, rolling to Aug 9 515 puts
Some also initiated fairly standard put spread sales like:
Sell Aug 16 523 puts, buy Aug 16 520 puts
The purpose of these put rolls is to take profits while maintaining or increasing leverage to chase the potential continuation lower.
Taking profits on a big put winner is often a challenge - you want to lock in gains, but are afraid of missing further upside by closing. Rolling is a critical skill to manage this.
Typically Put buyers adjust three levers when rolling:
Extending expiration
Reducing size
Increasing or lowering strike
Looking at the SPY flows, the common theme was little adjustment to expiration dates. In fact some even rolled to nearer-dated puts to further reduce premium paid.
This sends a clear signal that dealers expect this selloff to climax in the week of August 2nd.
Not only does that week feature major tech earnings like AAPL, MSFT, AMZN, META, but we also have the next FOMC rate decision on Friday 8/4.
So there was little need to extend expiration dates, and rolling to nearer puts actually reduces premium burned.
In terms of SPY downside target, the 530 area aligns with our prior 7/24 lows, leaving another 2% pullback potential.
Cross-referencing individual stock pullbacks to those levels, I'll likely re-establish some put spread collars next week as a hedge against an excessive move lower.
My TSLA and NVDA rolls are already in place:
TSLA: Sell $TSLA 20240802 245.0 CALL$ , Buy $TSLA 20240802 210.0 PUT$
NVDA: Sell $NVDA 20240802 120.0 CALL$ , Buy $NVDA 20240802 100.0 PUT$
For $Invesco QQQ(QQQ)$ similar downside to the 450 area.
Not a lot of outright put buying previously, with flows skewed more bullish. But we did see some midweek put initiations like:
Buy Sept 30 450 Puts, Sell Sept 30 430 Puts
Buy Dec 20 450 Puts, Sell Dec 20 400 Puts
As well as continued bullish put spreads:
Sell Sept 20 470 Puts, Buy 1.5x Sept 20 435 Puts
Not saying those are wrong, more just don't stare at unrealized P/Ls next week as a snapback is likely by September.
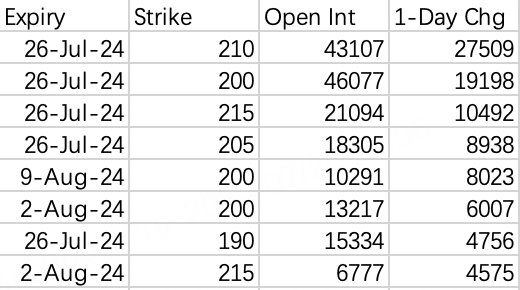
Top open put strikes for TSLA this week: 200, 210, 220, 215, 205.
Wednesday's new put additions were heavily skewed towards weekly expiries in very methodical strikes, giving off a similar vibe to that NVDA 4/19 flow.
So we're back to that high probability / low probability framework. High probability path seems to be a floor around 220, with low probability danger down towards 200.
Also a bit of an awkward situation - remember when I did that analysis last Tuesday trying to dissect the bizarre TSLA Sept 300 call buying in the 20240920 300 Calls?
Well those players closed out 37,800 contracts on Wednesday for an 80% loss.
I mean, guys, what were you even doing there?
You could've just bought calls outright, but the little general over here had to completely overthink it. My brain was fried after that analysis.
I was shocked to see 105 put prints actually make money at the open today - that's some wildly out-of-the-money strike to be hitting.
Where TSLA seems positioned for the selloff to be over this week, NVDA continues setting up for further downside potential in the coming weeks, a clear divergence.
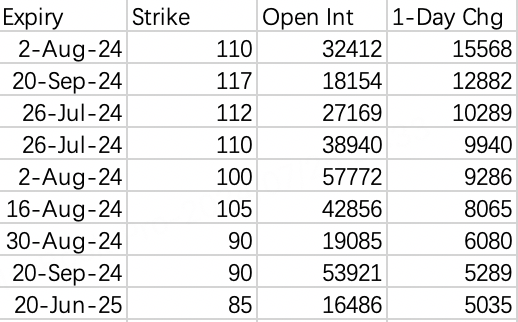
Top open put strikes for the week: 110, 115, 120, 100, 112
Flipping to calls, new positioning is tightly clustered in a upside strikes like 120, 125 - so a bounce back to 120 wouldn't surprise.
That Sept 117 put adding caught my eye - looks like an initiation of a put spread vs call sale:
Sell NVDA 20240920 140 Calls
Buy NVDA 20240920 117 Puts
I was going to say not a bad structure, but it appears to have been closed out intraday. I'm wondering if those were the same guys from the 300 TSLA calls.
There was also some bullish speculation like:
Buy Oct 100 Calls, Sell 3x Oct 150 Calls
Overall, if we do see a dip towards 100-105, selling puts for a premium wouldn't be a bad plan - higher risk tolerance can look to sell at-the-money, lower can look farther out-of-the-money.
But it may also pay to wait for cleaner bullish flow signals, especially multi-leg spread buying.
Disclaimer: Investing carries risk. This is not financial advice. The above content should not be regarded as an offer, recommendation, or solicitation on acquiring or disposing of any financial products, any associated discussions, comments, or posts by author or other users should not be considered as such either. It is solely for general information purpose only, which does not consider your own investment objectives, financial situations or needs. TTM assumes no responsibility or warranty for the accuracy and completeness of the information, investors should do their own research and may seek professional advice before investing.


Ok 👌
Great article, would you like to share it?