US Dollar Technical Analysis – Attempting to Sneak Higher?
Although domestic investors are focusing on chinese stock market, which opened today, as external observers and traders, we are always paying attention to the changes in the futures market.
During the National Day holiday, the performance of crude oil was remarkable, but it was expected. Relatively speaking, the rise of the U.S. dollar index, which had been falling before, after the interest rate cut is also worthy of attention.
We have talked about the logic of the rebound of the US dollar before the interest rate decision. A very important point is that in the latest round of interest rate hike-interest rate cut cycle, the foreign exchange market reflects the trend of expected rise/fall and reverse operation after landing.
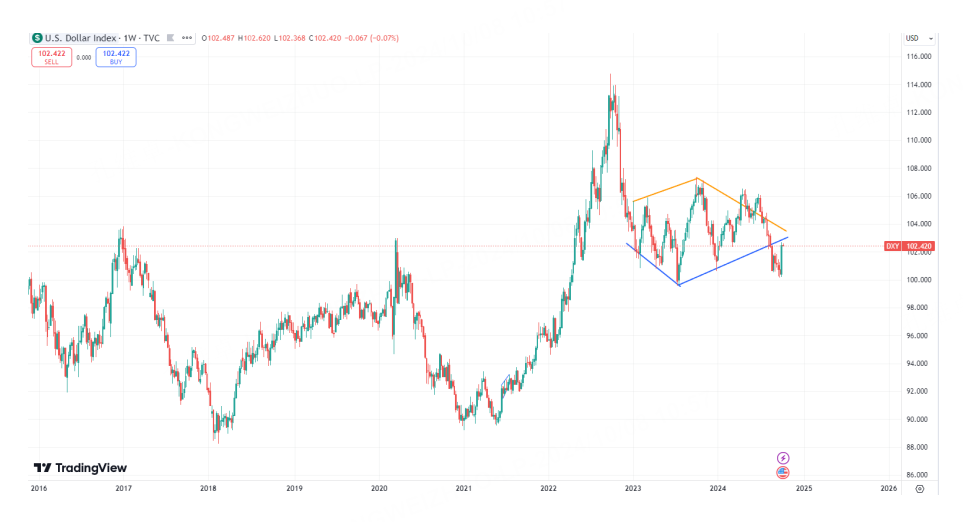
The fact that the Federal Reserve raises interest rates ahead of the European Central Bank and cuts interest rates behind the ECB determines that the US dollar first suppresses and then rises. The rebound that held the low point of the key diamond pattern recovered several weeks of negative decline with just one weekly K-line. But whether greater progress can be made may pave the way for the subsequent financial market.
Investors familiar with the foreign exchange market may more or less know that the US dollar has acted as a safe haven for many periods. Because when the market lacks topics and faces a general decline, the U.S. dollar and U.S. bonds will naturally absorb funds. In other words, the volatile market of the US dollar is the norm and represents the stability of the financial market; When the dollar rises sharply, it will be associated with a cyclical global plunge.
The current dollar price is naturally far from the sharp rise, and the level around 102 is also the central axis range of the past year and a half. It is more likely that the US dollar will maintain a large range fluctuation before the general election. Only by breaking through the high point of 107.3 can the start of the trend be truly announced, just like falling below the reference value of 99.57.
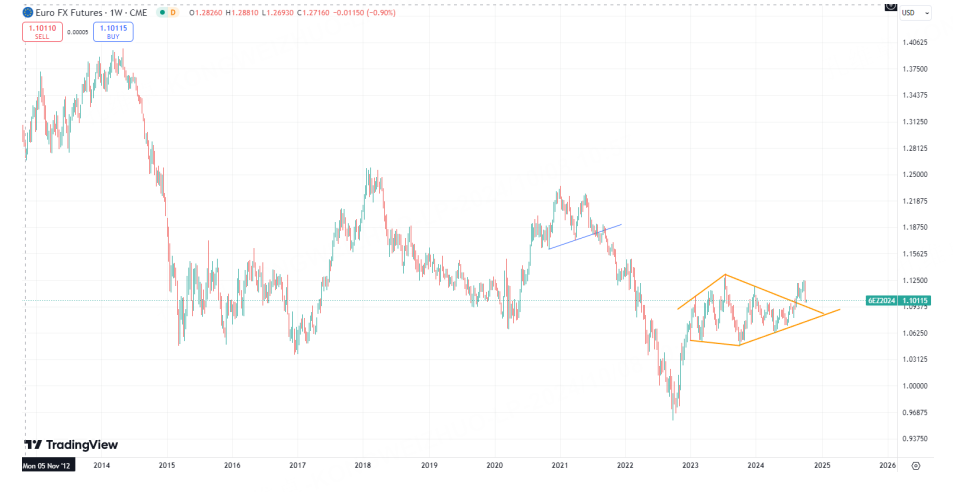
Although the possibility of short-to medium-term market start is not high, it does not mean that some prescient funds are deployed in advance. We can judge the progress of the US dollar market by comparing the performance of the euro. Since 2018/2021, the downward trend at the weekly level of the euro has been relatively obvious. When the high suppression of 1.236 is effective, this situation will not change significantly. Looking closer to the time period, the non-standard diamond pattern support is currently in the range of 1.06/07, close to the swing low of the monthly line. If the short sellers make an effective breakthrough at the above points, we can basically judge that the big market of the US dollar is coming.
The yen is another reference direction. Although it is the second largest opponent of the US dollar index, the situation and usage logic of the yen are different. The financing attributes of the Japanese yen have been introduced before, so the strength of the Japanese yen actually has a similar effect to the US dollar in a safe-haven environment. This means that the rise and fall of the yen should be divided into two stages: in the overall stable stage of the market, the U.S. dollar rises and the Japanese yen is under pressure; in the period of market turmoil, the U.S. dollar rises but the Japanese yen will rise more fiercely. Specifically, if USD/JPY goes to test 152 or breaks up, it implies that it will play music and dance, while breaking down 140 means that the form is greatly bad. If it fluctuates within this range, it will continue the previous main trend and will not affect the overall pattern and bull-bear conversion.
On the whole, the US dollar held its low point and retained the opportunity to start a big market at the end of the year. Although the current rising reference value is limited, after years of silence in the foreign exchange market, it seems that it is its turn to have a wave of market prices.
$NQ100 Index Main 2412 (NQmain) $$SP500 Index Main 2412 (ESmain) $$Dow Jones Index Main 2412 (YMmain) $$Gold Main 2412 (GCmain) $$WTI Crude Oil Main 2411 (CLmain) $
Disclaimer: Investing carries risk. This is not financial advice. The above content should not be regarded as an offer, recommendation, or solicitation on acquiring or disposing of any financial products, any associated discussions, comments, or posts by author or other users should not be considered as such either. It is solely for general information purpose only, which does not consider your own investment objectives, financial situations or needs. TTM assumes no responsibility or warranty for the accuracy and completeness of the information, investors should do their own research and may seek professional advice before investing.
