When will CTA stop selling-off? Take this key support seriously!
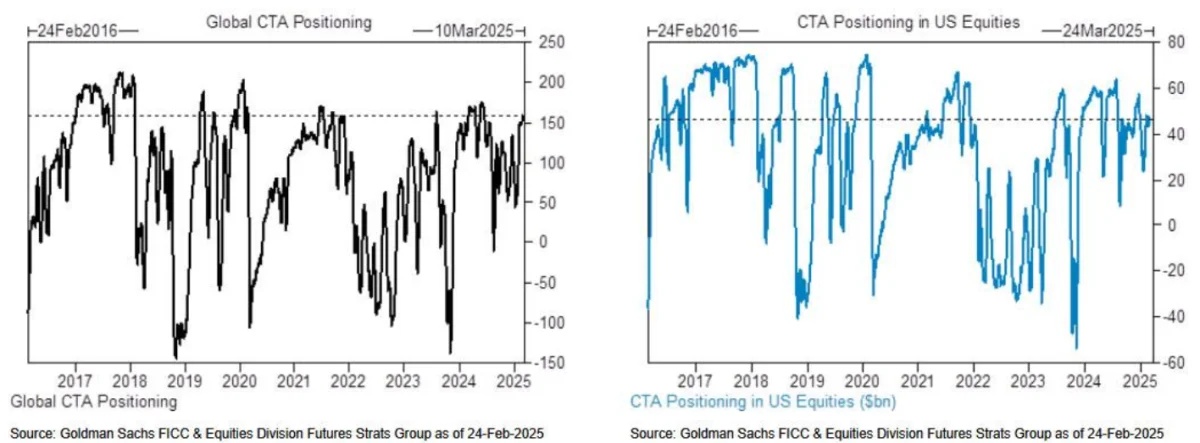
CTA's long global equity position reached $158 billion at the end of February (historical 90th percentile), US equities were also close to the historical 90th percentile (According to Goldman Sachs).

Impact of quantitative trading on the current market
CTA primarily employs a trend-following strategy, which involves identifying and capitalizing on market trends.When the market is trending downwards, the CTA will sell to maintain a position in line with the trend.
This strategy is systematic and reactive, i.e., it reacts to market movements rather than predicting them, and is therefore a form of ex post facto analysis.
And in recent years there has been a trend for CTAs to be traded in this way:
Self-enforcement of trend-following mechanism
CTA identifies market trends through algorithms, and when prices fall below key support levels, the program automatically triggers stop-loss or reverse short orders.
For example, after the S&P 500 fell below the medium-term support level of 5,897 points, the selling pressure of CTA was systematically amplified, forming a vicious cycle of "down → triggering selling → further decline".
Goldman Sachs data show that, as of last Friday, CTA in the global stock market held a long position of 137 billion U.S. dollars (78% of the historical level of points), once the trend is reversed, the pressure to close the position will show exponential growth.
Lack of liquidity exacerbates volatility
Currently the liquidity in derivatives markets such as S&P 500 futures (E-mini) $S&P 500 Mini-SPX(.XSP)$ s at a low level, and large trades are prone to triggering sharp price fluctuations.
When CTAs sell off in a concentrated manner, the market lacks sufficient buyers to take up the slack, leading to an accelerated downward price movement and further triggering sell signals from more quantitative models.
Chain reaction of multiple support levels
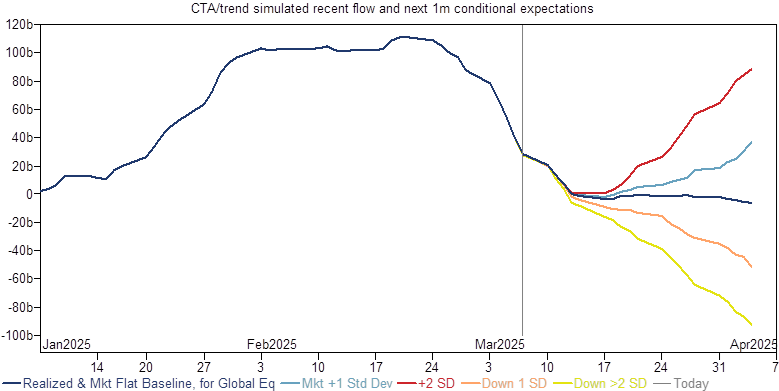
According to the Goldman Sachs model, support levels for the S&P 500 are categorized as short-term (6031) (broken), intermediate-term (5897) (broken) and long-term (5418).For each break below a key level, the CTA strategy adjusts its position according to preset rules, with the size of the sell-off scaling up incrementally.
If the downside continues to 5418 points, the average monthly sell-off is expected to soar to $130 billion from the benchmark's $46 billion.
$Goldman Sachs(GS)$ data shows $57 billion has already been sold in the 1st week of March and $39 billion is expected to be sold this week, with a sharp decline likely thereafter.
At the current pace, at current prices, the intended target will be reached more quickly.
Definition of Benchmark Sell and Trigger Logic
Benchmark sell points in a CTA strategy are not fixed, but are based on predefined and dynamic selling thresholds, usually based on the following two types of indicators:
Technical indicators
- Price Support Levels: Indicators that are often determined based on averages as well as volume, such as the S&P 500's 5,897, which triggers an intermediate-term sell-off when broken, are more clearly quantified values;
- Volatility thresholds: the algorithm reduces exposure when market volatility (e.g. $Cboe Volatility Index(VIX)$ ) breaks through a critical value.
- In addition, it will also choose to test sensitivity against interest rates, correlations, etc., but the main metrics are still the two above.
Rules for position management
- Risk parity model: dynamic adjustment of positions based on portfolio volatility, automatic position reduction in case of market downturn;
- Stop-loss mechanism: e.g. mandatory position closure when position loss exceeds 2x standard deviation of historical retracement, may vary depending on HF's strategy.
Current market peculiarities
Short positions and liquidity traps: in addition to long positions for, hedge funds recently held the second largest short position in nearly five years, which should have supported the market by covering shorts, but CTA selling dominated price direction in a liquidity-depleted environment.
Cross-asset linkage effect: Volatility in linked assets such as Bitcoin $Bitcoin(BTC.USD.CC)$ (which is influenced by Trump's policies) has also indirectly exacerbated stock market uncertainty, further reinforcing the safe-haven sell-off in CTAs.
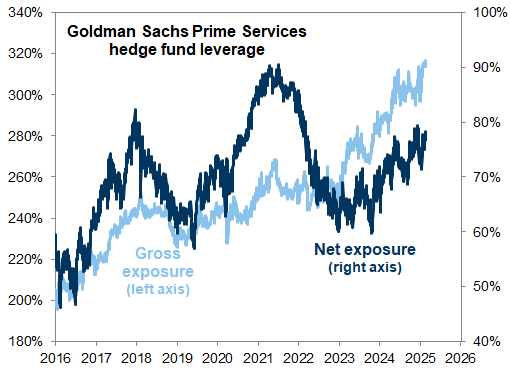
The urgency of deleveraging: since 2024, hedge funds' gross and net exposure to leverage has risen significantly, with short positions in individual stocks having risen to their highest levels since 2020
Summarize.
The size of CTA's quantitative passive selling depends on the strength of the trend and the degree of breakout of key levels.Benchmark selling is a dynamic risk-control rule that is pre-programmed into the strategy, combining technical indicators and position management to create a "domino effect" in programmed trading.
In the current market environment, the lack of liquidity and the loss of multiple levels of support has led to a non-linear increase in the size of the sell-off.
Currently, the key "long-term support level" for the S&P 500 is 5,418, but this may be dynamically adjusted with changes in the VIX index, etc., and the range of starting standard deviations may also change.
Changes in short positions, cross-asset linkages, and the need for hedge fund deleveraging are all unique to the current market environment and need to be faced with caution.
Apendix
Top 10 weights in $NASDAQ 100(NDX)$
Disclaimer: Investing carries risk. This is not financial advice. The above content should not be regarded as an offer, recommendation, or solicitation on acquiring or disposing of any financial products, any associated discussions, comments, or posts by author or other users should not be considered as such either. It is solely for general information purpose only, which does not consider your own investment objectives, financial situations or needs. TTM assumes no responsibility or warranty for the accuracy and completeness of the information, investors should do their own research and may seek professional advice before investing.
- j islandfund·2025-03-12computer say sell🤖⭐1Report
- TheBeautyofOptions·2025-03-11Thanks for sharing your analysis1Report