IBKR Set to Join S&P 500, What Is The Capital Inflow Potential?
Abstract
$Interactive Brokers(IBKR)$ is a leading company in the brokerage industry with strong fundamentals. In Q2 2025, it delivered a strong performance with "business accelerating at a high pace": revenue of $1.48 billion, EPS of $0.51, pre-tax profit margin of ~75%, and double-digit growth in the number of clients, DARTs, and client assets.
Index event catalyst. The company will replace $Walgreens Boots Alliance(WBA)$ in the S&P 500 Index on August 28. If we only consider the impact of passive funds on the S&P 500 ETF, the required passive buying volume is approximately $3.9 billion, minus the passive selling volume from mid-cap funds, the net inflow is estimated to be approximately $2.9 billion to $3.7 billion; if all passive assets tracking the S&P 500 are included (a broader scope), the net inflow could rise to the tens of billions of dollars (approximately $7 billion to $15 billion).
Timing differs from medium- to long-term judgments. If you are an event trader, August 28 and the September rebalancing date are obvious "windows" for action. If you are a value/medium- to long-term investor, the strengthening of fundamentals in Q2 is the decisive factor—index inclusion is a catalyst but not the source of sustained growth.
Interactive Brokers is not a "regular brokerage firm."
Interactive Brokers' long-term competitive advantage can be summarized in three points: technology platform + global multi-product liquidity + asset and liability management capabilities.
In terms of technology and execution, its intelligent order routing, API, and professional-grade platform have always been the core attractions for active traders, institutions, and professional traders. Low latency, low fees, and access to a vast array of markets give it a natural appeal among high-frequency, intraday, and arbitrage traders.
In terms of diversification, multiple revenue streams such as commissions/transaction fees, net interest (customer credit balances and secured loans), securities lending, and proprietary trading enable the company to achieve different forms of revenue balance during market fluctuations and interest rate cycles.
Its internationalization and product coverage support multiple currencies, multiple markets, options/futures/foreign exchange/cryptocurrency, and other businesses, enabling its platform to capture global capital flows more efficiently.
These characteristics determine that when the user base expands and activity increases (DARTs growth), the leveraged revenue growth rate will be significantly higher than that of traditional brokerage firms driven solely by commissions. This is precisely the long-term logic behind the data from the past few quarters.
Recent performance – High-quality Q2 but also one-off factors
Total revenue reached US$1.48 billion, representing a year-on-year increase of 20.3% and a quarter-on-quarter increase of approximately 8%, exceeding market consensus expectations by 9.63%. This was primarily driven by a surge in trading volume and favorable interest rate conditions, reflecting opportunities arising from market volatility and active trading in AI-related stocks; commission income accounted for a higher proportion of total revenue, while net interest income reached a record high. In terms of business structure, brokerage services are increasingly globalized, with a significant increase in the proportion of international clients among new customers, indicating enhanced long-term customer loyalty.
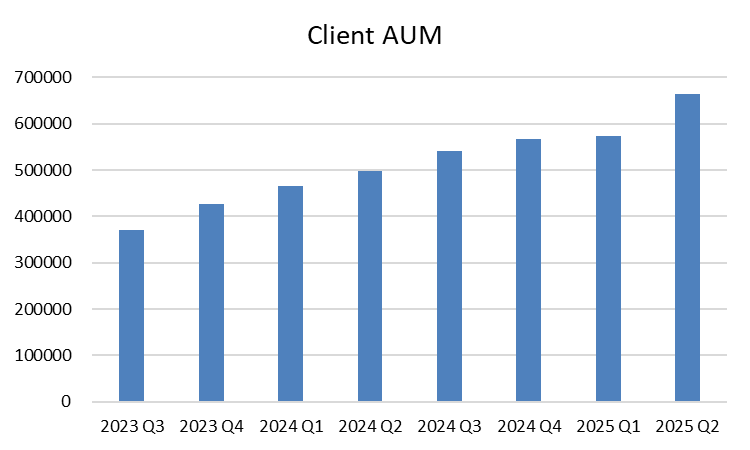
Adjusted EPS of $0.51, representing a significant year-over-year increase and stability quarter-over-quarter; key drivers include cost control and operational leverage, with a pre-tax profit margin as high as 75%; outperformed market consensus by 10.87% (expected $0.46). The company's profitability quality exceeded expectations; signs of business changes include a 34% expansion in customer asset size to $664 billion, driving growth in leveraged loans and cash balances, but also exposing reliance on interest rate conditions.
Net interest income reached a record $860 million, driven by growth in customer credit balances and margin loans, with total assets increasing by 33% to $181 billion; Customer accounts and daily average revenue trades (DARTs): 250,000 new accounts were added, bringing the total to 528,000 year-to-date, with total customer equity growing by 34%. Growth was driven by market volatility and AI-themed investments. However, the current high-interest-rate environment supported a pre-tax profit margin of 75%, with the business structure shifting toward greater reliance on high-net-worth clients and institutional trading.
Why is this report cause for celebration?
Double growth in users and activity: The rapid growth in the number of customers and DARTs indicates that not only are new users entering the market, but the average transaction frequency and complexity per user are also increasing—this is the fundamental driver behind the simultaneous expansion of commissions, clearing, and interest.
Interest and credit operations remain the "cash cow": increases in customer credit balances and guaranteed loan volumes generate sustained net interest income, which is one of the long-term profit drivers for securities firms (although subject to interest rate fluctuations).
High profit margin: A pre-tax profit margin of 75% is among the highest in the financial services industry, indicating that economies of scale and cost control are both working effectively.
The company also made noteworthy contributions in areas such as monetary strategy and proprietary trading (financial reports show strategic gains and one-time items), enhancing the "resilience" of its quarterly earnings.
It is important to note that several non-recurring gains (tax refunds, short-term gains from monetary policy) contributed positively to net income for the quarter, and it remains to be seen whether this will continue in future quarters. Performance is highly dependent on trading activity. If market volatility declines sharply or funds shift to long-term holding strategies, DARTs and commission income may decline, leading to significant profit volatility.
Inclusion in the S&P 500: Mechanism, Scale, and Impact
IBKR will be upgraded from the S&P MidCap 400 Index and replace the privatized WBA in the S&P 500 Index.
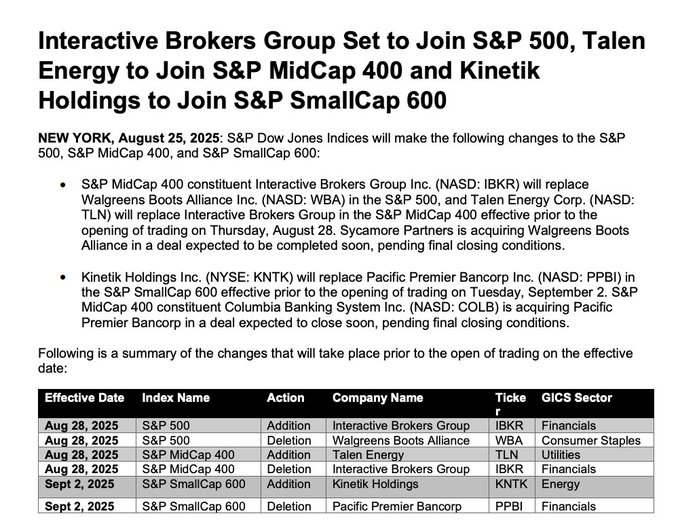
This is a "typical but easily misinterpreted" event. Normally, on the effective date (August 28), IBKR is included in the S&P 500 using the "nominal weight" of the component it replaces, WBA. Subsequently, during quarterly rebalancing (typically in March, June, September, and December), its weight is re-determined based on actual market capitalization, and passive products are rebalanced according to the new weights. However, when $Palantir Technologies Inc.(PLTR)$ was added to the SPX, its weighting was calculated based on its actual free-float market capitalization. Therefore, IBKR's inclusion in the SPX may also involve a one-time weighting adjustment.
Using our standardized approach (the three major S&P ETFs: $S&P 500 ETF (SPY)$ / $Vanguard S&P 500 ETF (VOO)$ / $S&P 500 Index ETF (IVV)$ + the three major S&P index mutual funds: VFIAX/FXAIX/SWPPX), we arrive at the following key metrics:
IBKR has a weighting of approximately 0.89% in the $SPDR S&P MidCap 400 ETF Trust(MDY)$ Based on IBKR's current market capitalization of approximately $105–106 billion, its target weighting in the SPX after inclusion is approximately 0.185%.
Since a significant amount of S&P 500 tracking funds (ETFs + index mutual funds) will be passively positioned, S&P 500 tracking ETFs alone (AUM ≈ $2.1T) may need to purchase approximately $3.9B of IBKR; If all passive products tracking the S&P 500 (ETFs + index mutual funds, with total assets estimated in the $5–8 trillion range) are included, the buying volume could range from approximately $4 billion to $13 billion.
However, it should be noted that IBKR is currently included in the MidCap 400 index, and passive MidCap funds (such as MDY, IVOO, SPMD, etc.) will sell their existing IBKR holdings. Adding up all passive MidCap sell orders, the total sell order volume could range from $0.5 billion to $2 billion. Therefore, the net passive capital inflow is estimated to be approximately $2.7 billion to $11.8 billion.
The average daily net purchase is approximately $1.36 billion, equivalent to approximately 418% of ADV. If the transaction is spread over five trading days, the daily impact will be reduced to approximately 1.64%.
Several mechanisms that dilute the impact in reality
ETF creation/redemption & AP hedging: Large S&P ETFs reduce the need for one-time spot trading by allowing authorized participants to use futures, basket trading, and cash hedging.
Market makers/hedgers and arbitrageurs: There are a large number of professional liquidity providers who absorb some orders and hedge them with derivatives, thereby mitigating spot shocks.
MidCap Sell-off Timing: Mid-cap funds do not necessarily sell all their holdings on the same day as the S&P complete stock replacement. In many cases, they will execute the sale in batches.
Therefore, the theoretically required "weight × AUM" does not equal the total spot trading volume for the day, but this does not change the fact that the event will bring short-term liquidity pressure and price fluctuations — especially on days with low liquidity or when market sentiment is fragile, the impact will be amplified.
Looking at the two events together: Why is the strong performance in Q2 combined with the index inclusion a "reasonable" double catalyst?
Fundamental validation of "sustainability": Even with several one-time gains, Q2's core signals (customer and transaction activity, credit balances, net interest base) do show a sustainable path for growth. This gives passive/active funds more reason to "put the stock in their portfolios."
The "visibility + passive holding" effect of being selected: Joining the S&P 500 will increase the proportion of passive holdings, increase roadshow attention, and may reduce future financing costs (or increase valuation premiums), which is a structurally neutral to positive change for long-term stock prices.
Event arbitrage and liquidity opportunities: Short-term "sell first, buy later" (net selling pressure on August 28 → net buying in September) provided event traders and market makers with arbitrage opportunities and inter-period arbitrage opportunities. For long-term investors, this was an opportunity to trade higher liquidity for lower price volatility.
In other words, Q2 provided "fundamental endorsement" for selection, and selection provided Q2 with greater opportunities for story dissemination and valuation re-evaluation.
Disclaimer: Investing carries risk. This is not financial advice. The above content should not be regarded as an offer, recommendation, or solicitation on acquiring or disposing of any financial products, any associated discussions, comments, or posts by author or other users should not be considered as such either. It is solely for general information purpose only, which does not consider your own investment objectives, financial situations or needs. TTM assumes no responsibility or warranty for the accuracy and completeness of the information, investors should do their own research and may seek professional advice before investing.
- AaronJe·2025-08-26The potential capital inflow looks promisingLikeReport
- bumpy·2025-08-26Big potential! 🚀LikeReport